29
/
en
AIzaSyAYiBZKx7MnpbEhh9jyipgxe19OcubqV5w
April 1, 2024
69462
Argentina
ARG
true
2
1
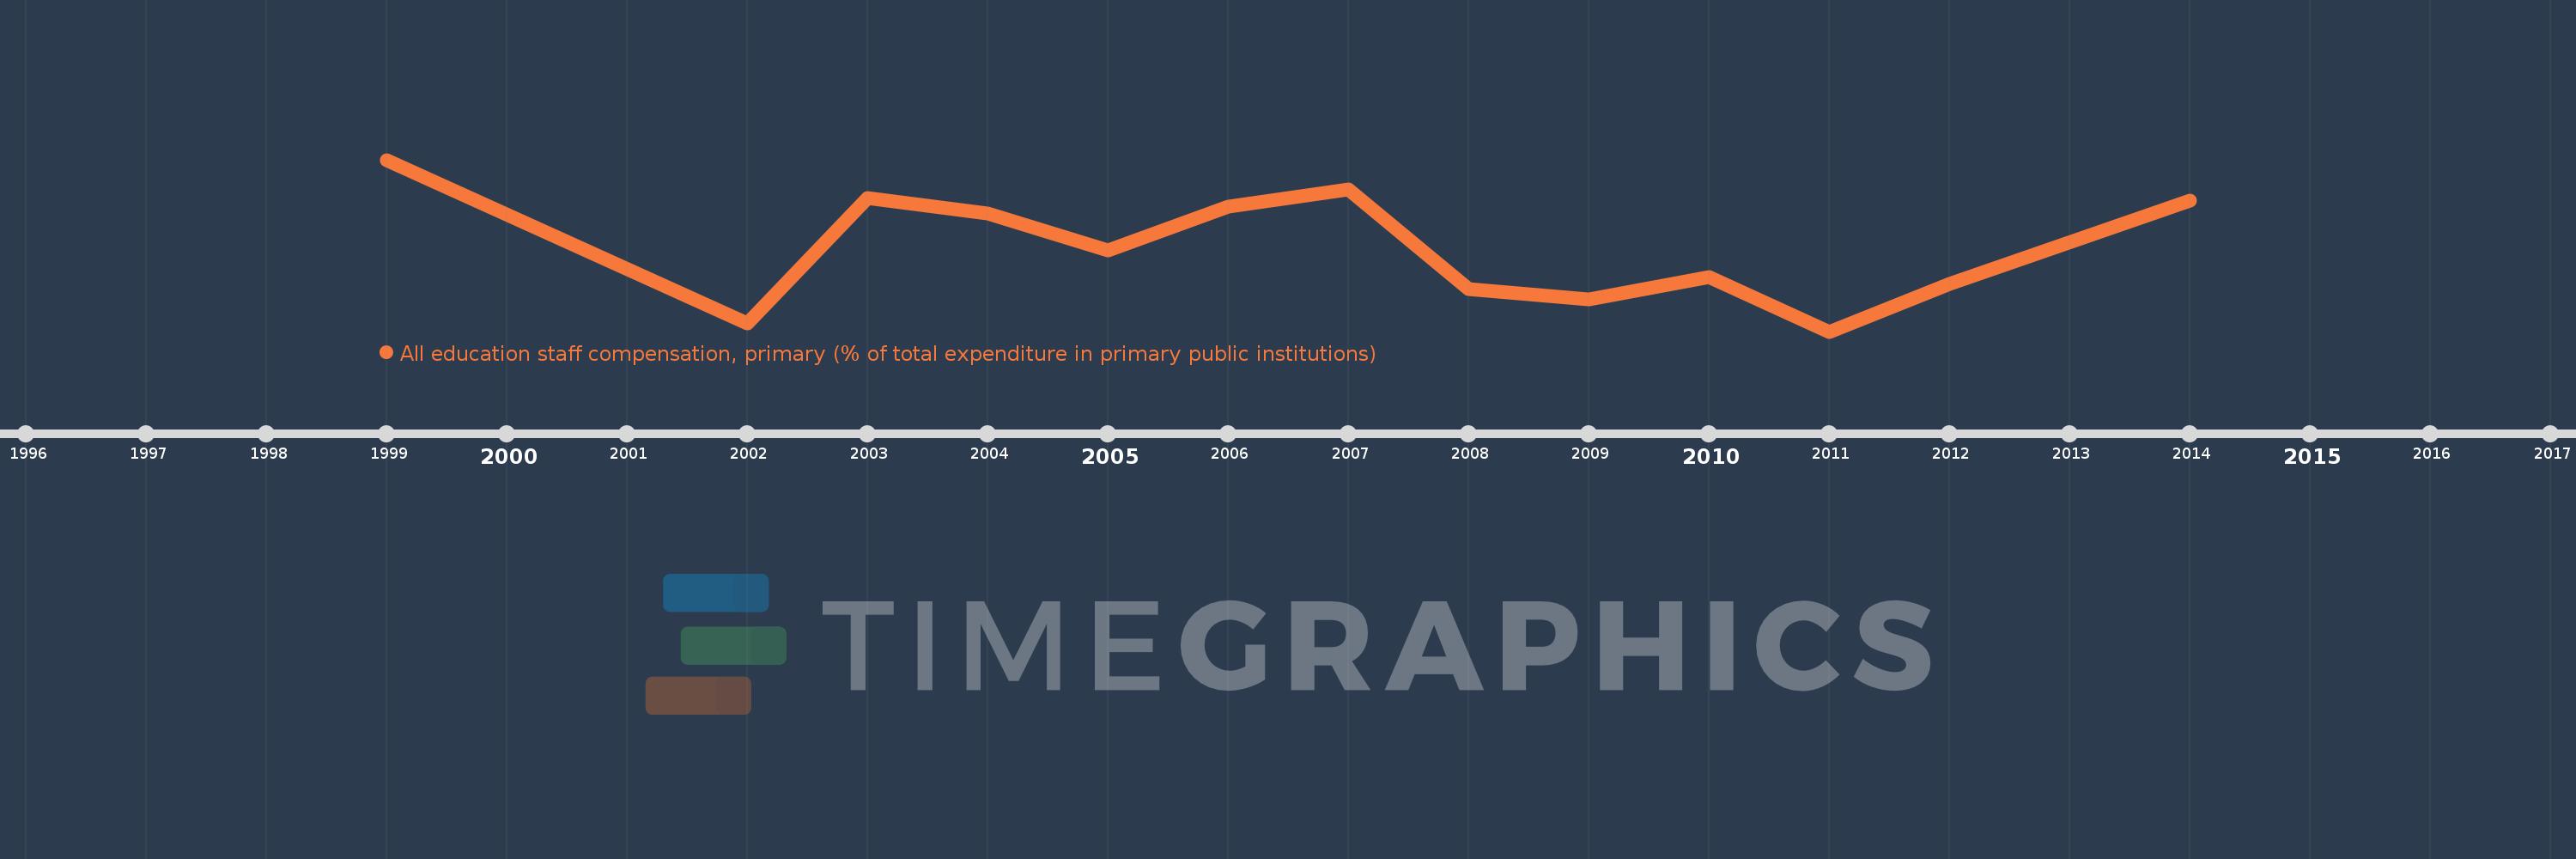
All education staff compensation, primary (% of total expenditure in primary public institutions)
2014,2012,2011,2010,2009,2008,2007,2006,2005,2004,2003,2002,1999
This statistics in other country:
Timeline:
This timeline shows a graph from 1999 to 2014 of Argentina. No data until 1998. Number of actual observations by date: 13.
Source name:
World Development Indicators
Source organization:
United Nations Educational, Scientific, and Cultural Organization (UNESCO) Institute for Statistics.
Categories, topics:
Education
Last updated:
apr 23, 2017
Indicators value changes by year
Minimum:
85.356
jan 1, 2011
At the date of observation
Value
Absolute change
Change from previous value
jan 1, 1999
89.57
+89.57
0.0%
jan 1, 2002
85.563
-4.008
-4.47%
jan 1, 2003
88.627
+3.065
3.58%
jan 1, 2004
88.255
-0.373
-0.42%
jan 1, 2005
87.337
-0.917
-1.04%
jan 1, 2006
88.431
+1.093
1.25%
jan 1, 2007
88.841
+0.41
0.46%
jan 1, 2008
86.4
-2.44
-2.75%
jan 1, 2009
86.151
-0.249
-0.29%
jan 1, 2010
86.698
+0.546
0.63%
jan 1, 2011
85.356
-1.342
-1.55%
jan 1, 2012
86.531
+1.175
1.38%
jan 1, 2014
88.559
+2.028
2.34%
Ranking of countries by current statistics by years


Comments: