29
/
en
AIzaSyAYiBZKx7MnpbEhh9jyipgxe19OcubqV5w
April 1, 2024
25496
Central Europe and the Baltics
CEB
false
2
1
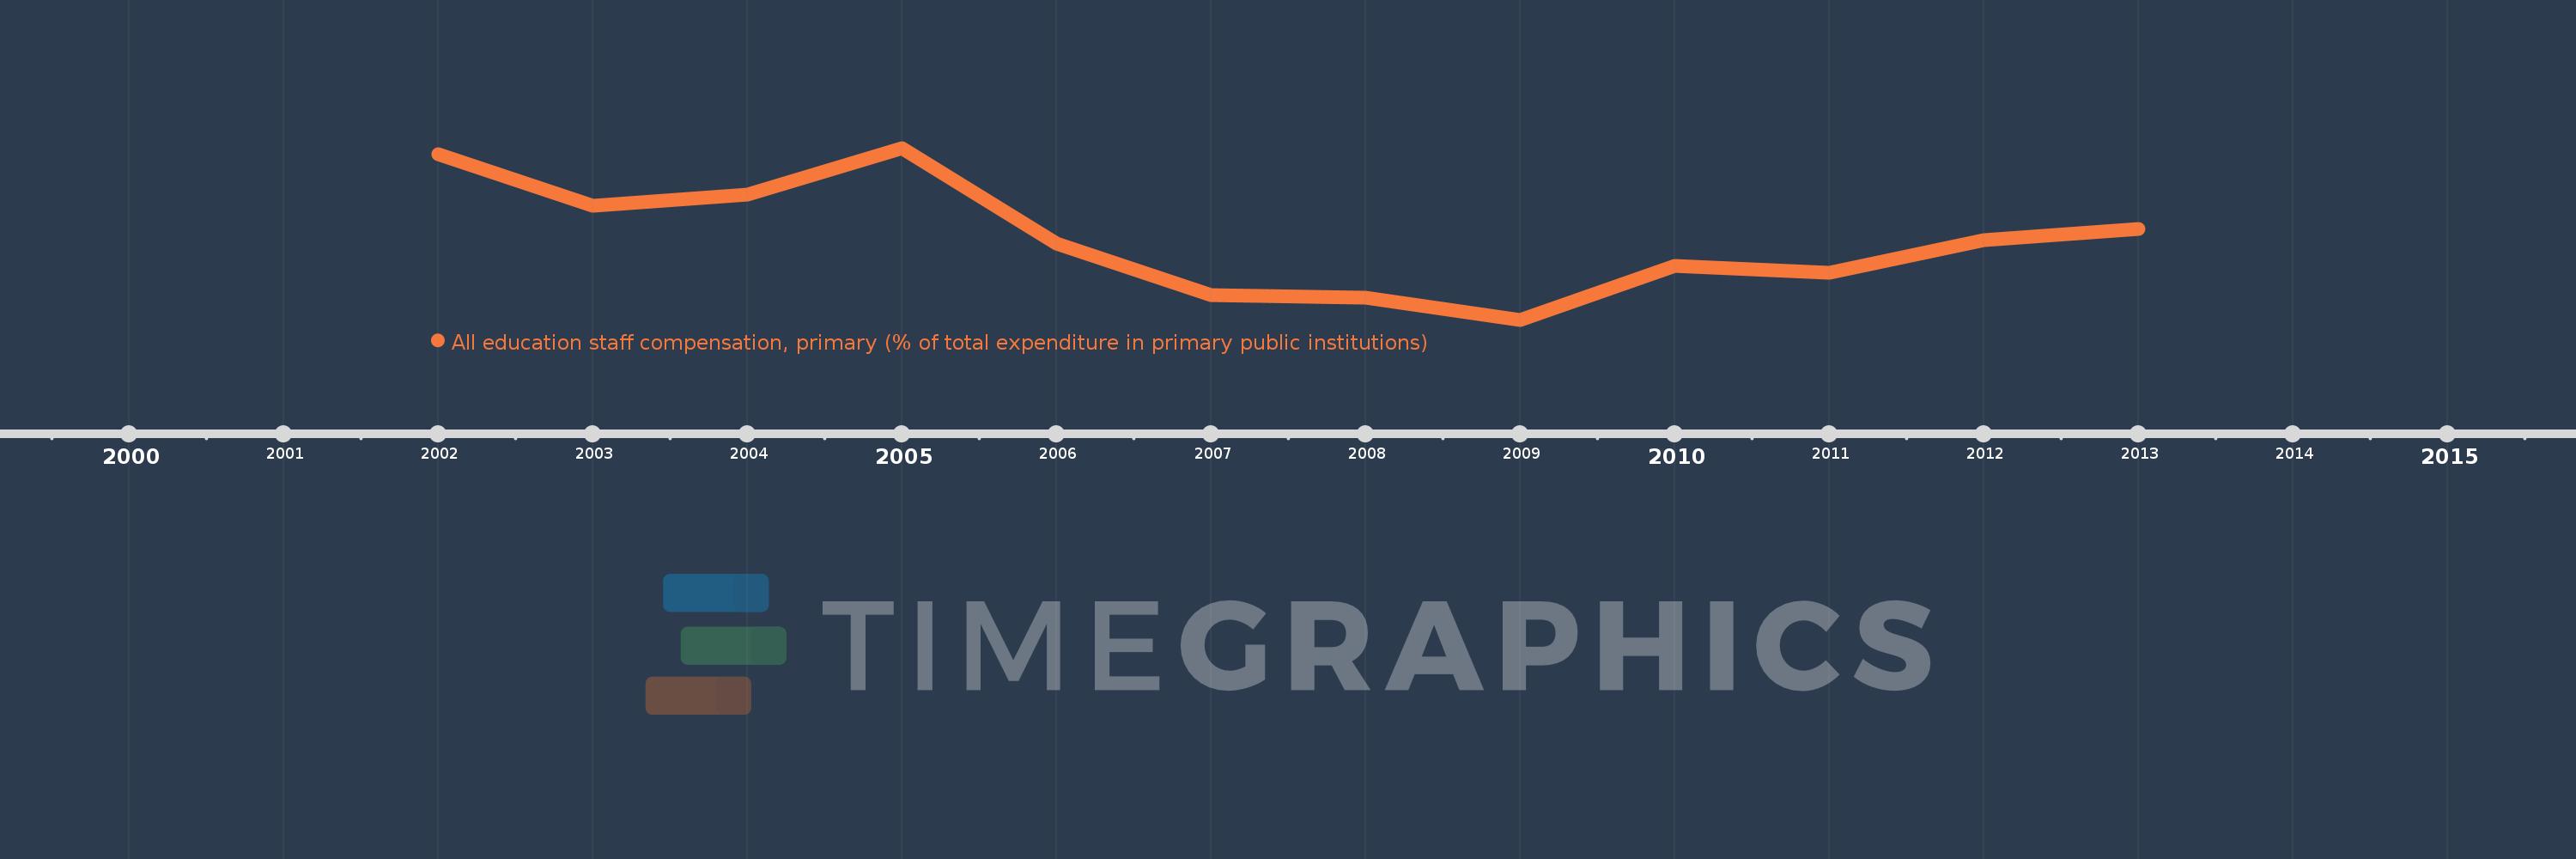
All education staff compensation, primary (% of total expenditure in primary public institutions)
2013,2012,2011,2010,2009,2008,2007,2006,2005,2004,2003,2002
This statistics in other country:
Timeline:
This timeline shows a graph from 2002 to 2013 of Central Europe and the Baltics. No data until 2001. Number of actual observations by date: 12.
Source name:
World Development Indicators
Source organization:
United Nations Educational, Scientific, and Cultural Organization (UNESCO) Institute for Statistics.
Categories, topics:
Education
Last updated:
apr 23, 2017
Indicators value changes by year
Minimum:
65.046
jan 1, 2009
Maximum:
72.295
jan 1, 2005
At the date of observation
Value
Absolute change
Change from previous value
jan 1, 2002
72.042
+72.042
0.0%
jan 1, 2003
69.865
-2.177
-3.02%
jan 1, 2004
70.325
+0.461
0.66%
jan 1, 2005
72.295
+1.97
2.8%
jan 1, 2006
68.246
-4.05
-5.6%
jan 1, 2007
66.093
-2.153
-3.15%
jan 1, 2008
65.963
-0.129
-0.2%
jan 1, 2009
65.046
-0.917
-1.39%
jan 1, 2010
67.328
+2.282
3.51%
jan 1, 2011
67.033
-0.295
-0.44%
jan 1, 2012
68.411
+1.377
2.05%
jan 1, 2013
68.882
+0.472
0.69%
Ranking of countries by current statistics by years


Comments: