29
/
en
AIzaSyAYiBZKx7MnpbEhh9jyipgxe19OcubqV5w
April 1, 2024
145336
Guinea
GIN
true
2
1
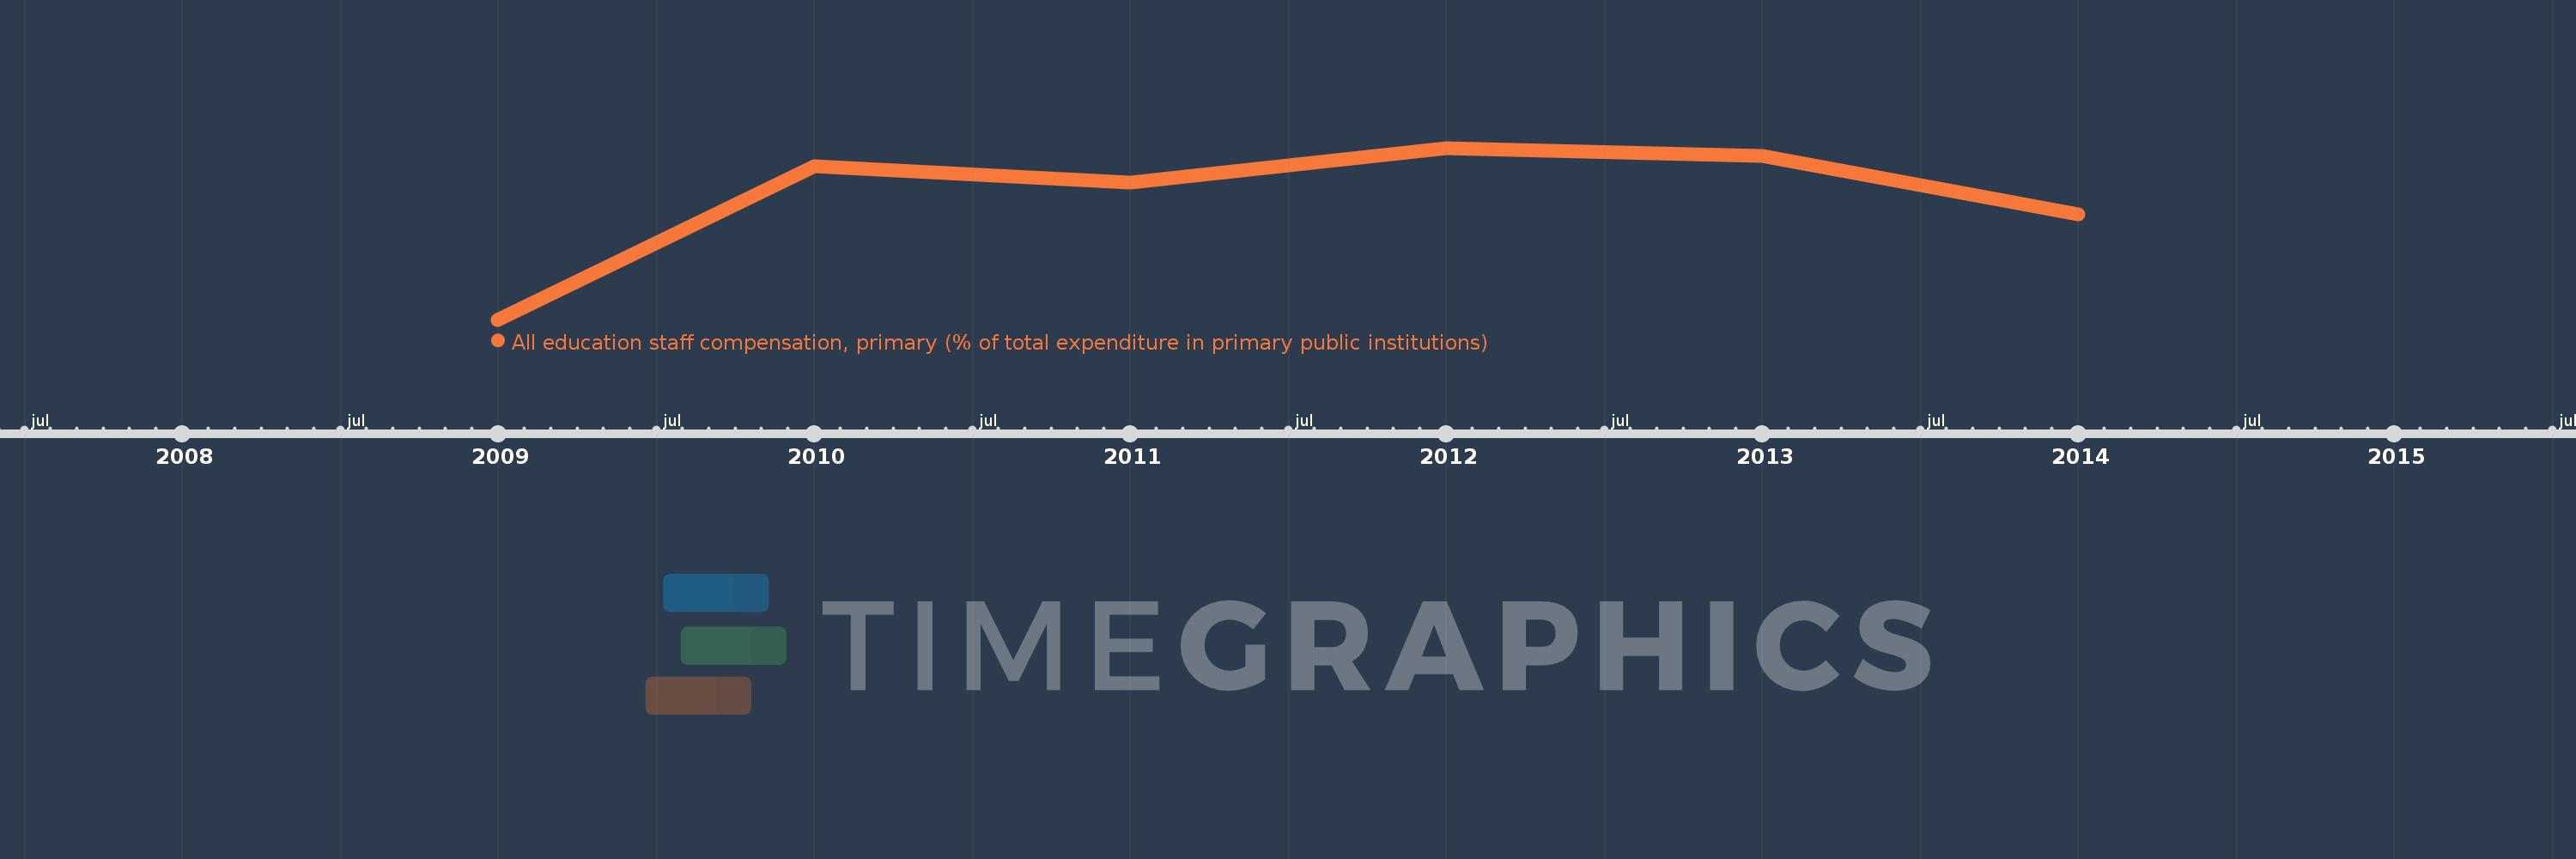
All education staff compensation, primary (% of total expenditure in primary public institutions)
2014,2013,2012,2011,2010,2009
This statistics in other country:
Timeline:
This timeline shows a graph from 2009 to 2014 of Guinea. No data until 2008. Number of actual observations by date: 6.
Source name:
World Development Indicators
Source organization:
United Nations Educational, Scientific, and Cultural Organization (UNESCO) Institute for Statistics.
Categories, topics:
Education
Last updated:
apr 23, 2017
Indicators value changes by year
Minimum:
38.839
jan 1, 2009
Maximum:
87.892
jan 1, 2012
At the date of observation
Value
Absolute change
Change from previous value
jan 1, 2009
38.839
+38.839
0.0%
jan 1, 2010
82.615
+43.775
112.71%
jan 1, 2011
77.978
-4.637
-5.61%
jan 1, 2012
87.892
+9.913
12.71%
jan 1, 2013
85.578
-2.314
-2.63%
jan 1, 2014
69.035
-16.543
-19.33%
Ranking of countries by current statistics by years


Comments: