29
/
en
AIzaSyAYiBZKx7MnpbEhh9jyipgxe19OcubqV5w
April 1, 2024
275425
United Kingdom
GBR
true
2
1
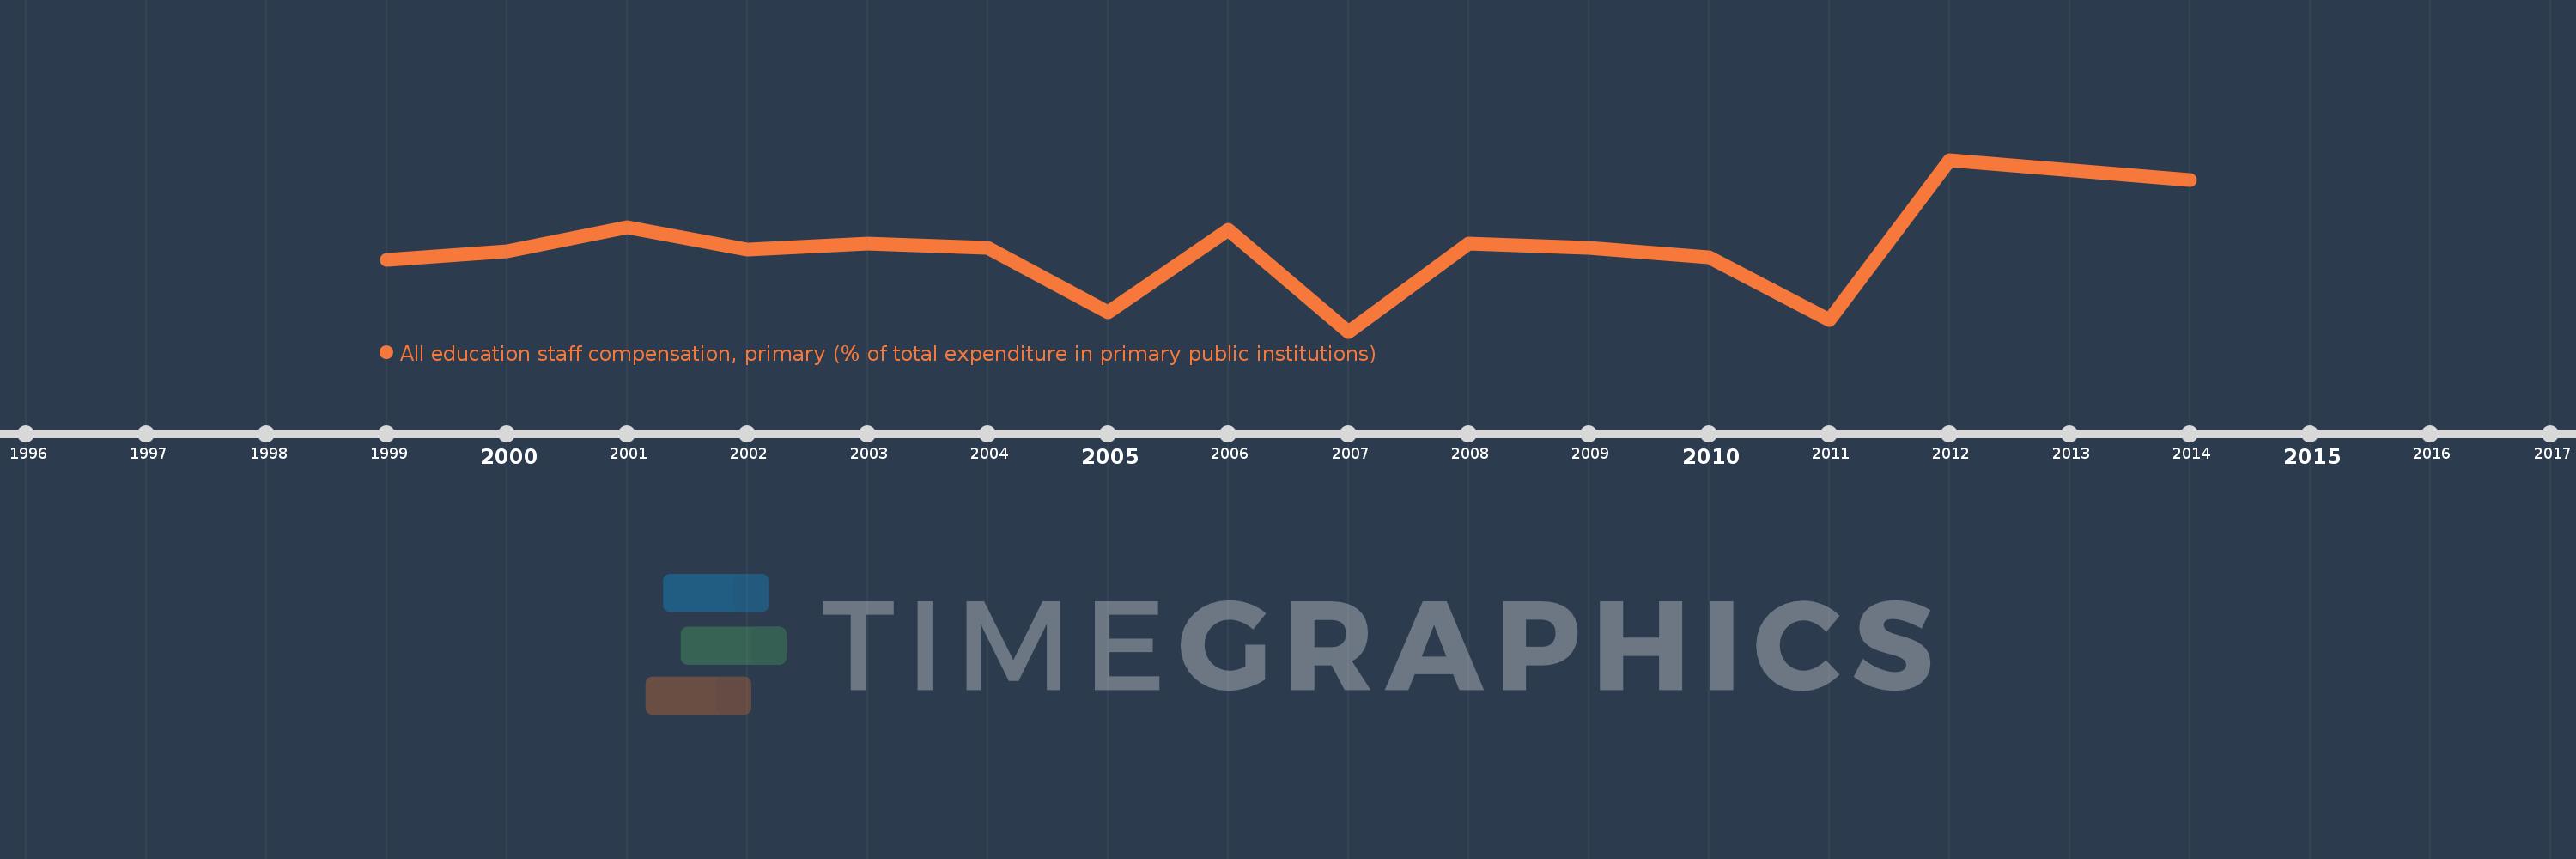
All education staff compensation, primary (% of total expenditure in primary public institutions)
2014,2012,2011,2010,2009,2008,2007,2006,2005,2004,2003,2002,2001,2000,1999
This statistics in other country:
Timeline:
This timeline shows a graph from 1999 to 2014 of United Kingdom. No data until 1998. Number of actual observations by date: 15.
Source name:
World Development Indicators
Source organization:
United Nations Educational, Scientific, and Cultural Organization (UNESCO) Institute for Statistics.
Categories, topics:
Education
Last updated:
apr 23, 2017
Indicators value changes by year
Minimum:
61.483
jan 1, 2007
Maximum:
78.102
jan 1, 2012
At the date of observation
Value
Absolute change
Change from previous value
jan 1, 1999
68.384
+68.384
0.0%
jan 1, 2000
69.278
+0.894
1.31%
jan 1, 2001
71.55
+2.272
3.28%
jan 1, 2002
69.416
-2.134
-2.98%
jan 1, 2003
69.974
+0.558
0.8%
jan 1, 2004
69.618
-0.357
-0.51%
jan 1, 2005
63.356
-6.262
-8.99%
jan 1, 2006
71.299
+7.943
12.54%
jan 1, 2007
61.483
-9.816
-13.77%
jan 1, 2008
69.993
+8.51
13.84%
jan 1, 2009
69.609
-0.384
-0.55%
jan 1, 2010
68.647
-0.963
-1.38%
jan 1, 2011
62.576
-6.071
-8.84%
jan 1, 2012
78.102
+15.526
24.81%
jan 1, 2014
76.172
-1.93
-2.47%
Ranking of countries by current statistics by years


Comments: