29
/
en
AIzaSyAYiBZKx7MnpbEhh9jyipgxe19OcubqV5w
April 1, 2024
163510
Japan
JPN
true
2
1
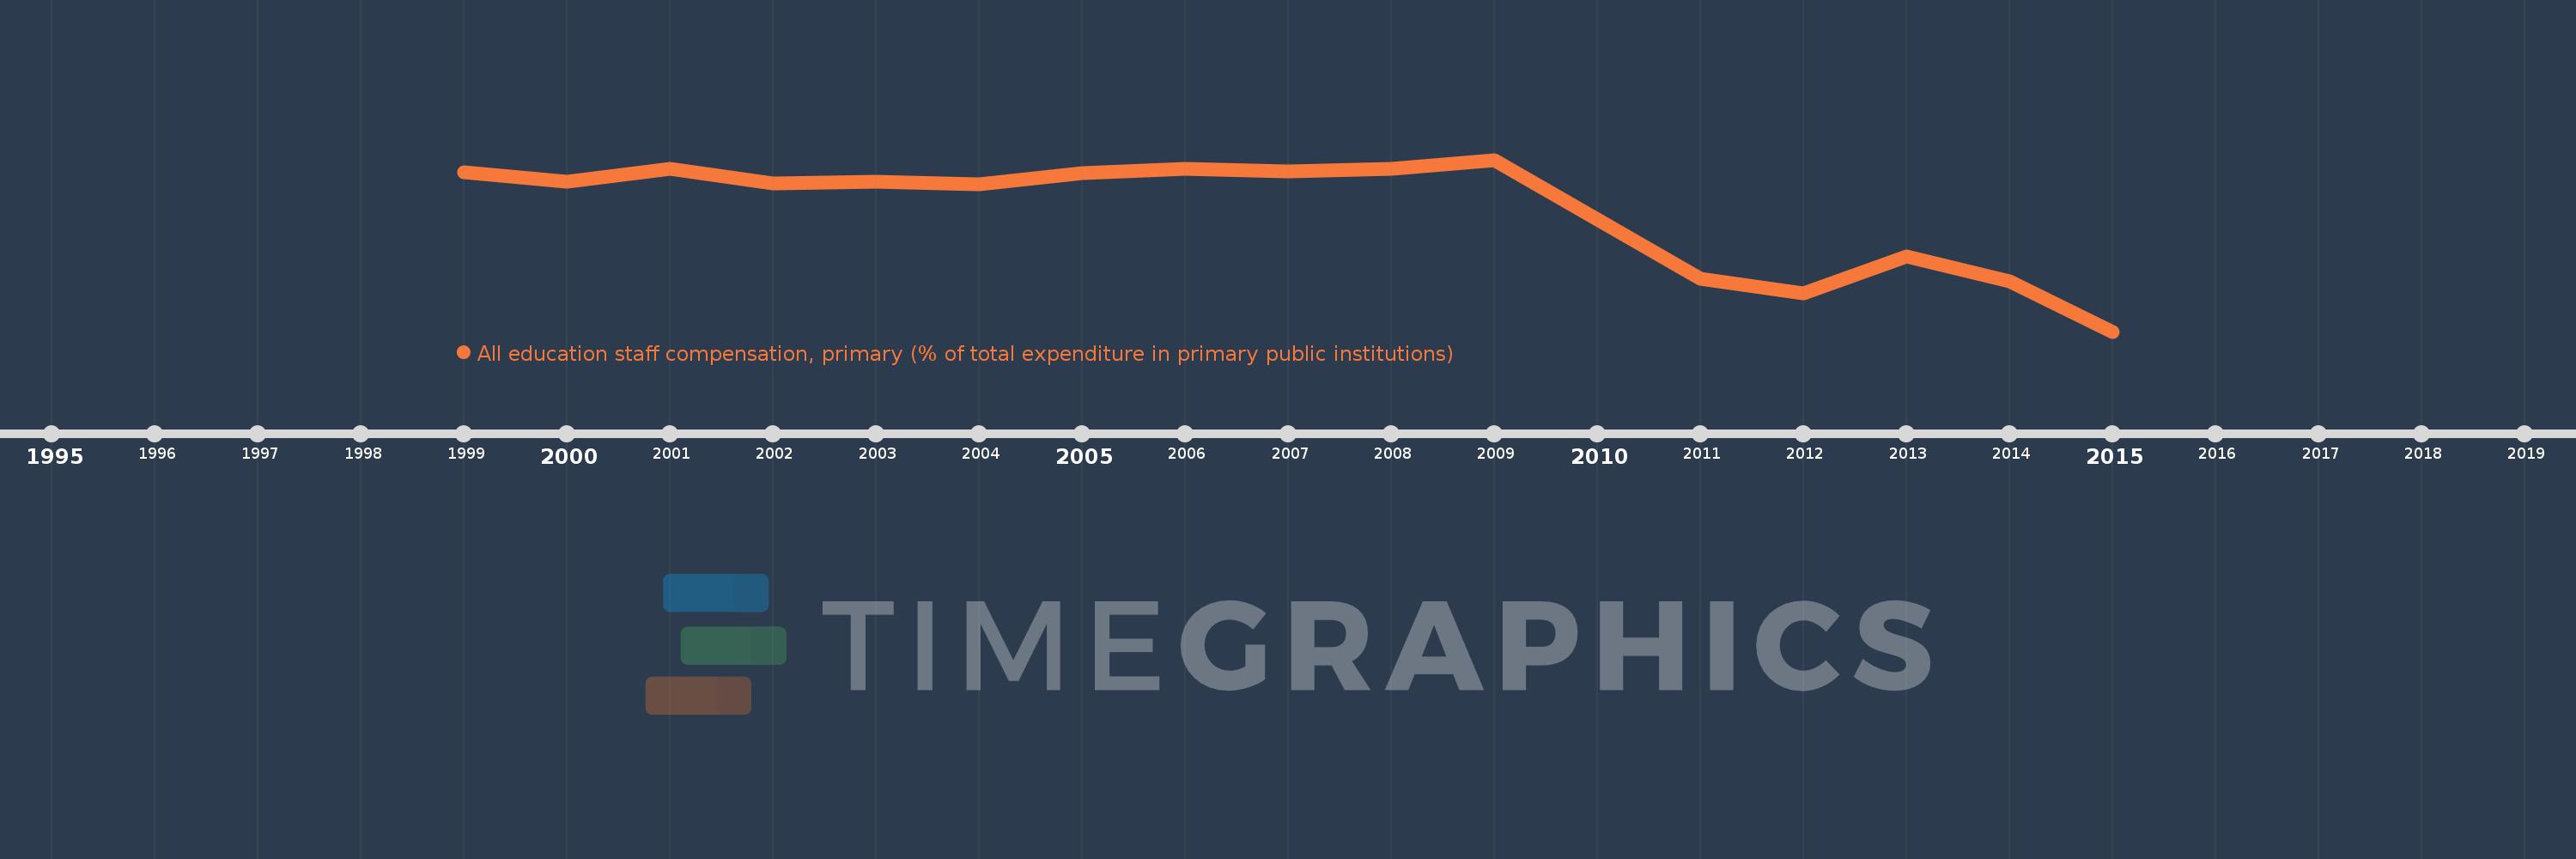
All education staff compensation, primary (% of total expenditure in primary public institutions)
2015,2014,2013,2012,2011,2009,2008,2007,2006,2005,2004,2003,2002,2001,2000,1999
This statistics in other country:
Timeline:
This timeline shows a graph from 1999 to 2015 of Japan. No data until 1998. Number of actual observations by date: 16.
Source name:
World Development Indicators
Source organization:
United Nations Educational, Scientific, and Cultural Organization (UNESCO) Institute for Statistics.
Categories, topics:
Education
Last updated:
apr 23, 2017
Indicators value changes by year
Maximum:
79.354
jan 1, 2009
At the date of observation
Value
Absolute change
Change from previous value
jan 1, 1999
78.866
+78.866
0.0%
jan 1, 2000
78.518
-0.348
-0.44%
jan 1, 2001
79.022
+0.504
0.64%
jan 1, 2002
78.441
-0.581
-0.74%
jan 1, 2003
78.514
+0.073
0.09%
jan 1, 2004
78.407
-0.106
-0.14%
jan 1, 2005
78.829
+0.421
0.54%
jan 1, 2006
79.005
+0.177
0.22%
jan 1, 2007
78.926
-0.079
-0.1%
jan 1, 2008
79.015
+0.088
0.11%
jan 1, 2009
79.354
+0.34
0.43%
jan 1, 2011
74.787
-4.568
-5.76%
jan 1, 2012
74.256
-0.53
-0.71%
jan 1, 2013
75.669
+1.413
1.9%
jan 1, 2014
74.701
-0.968
-1.28%
jan 1, 2015
72.78
-1.921
-2.57%
Ranking of countries by current statistics by years


Comments: