29
/
en
AIzaSyAYiBZKx7MnpbEhh9jyipgxe19OcubqV5w
April 1, 2024
42098
Latin America & Caribbean (excluding high income)
LAC
false
2
1
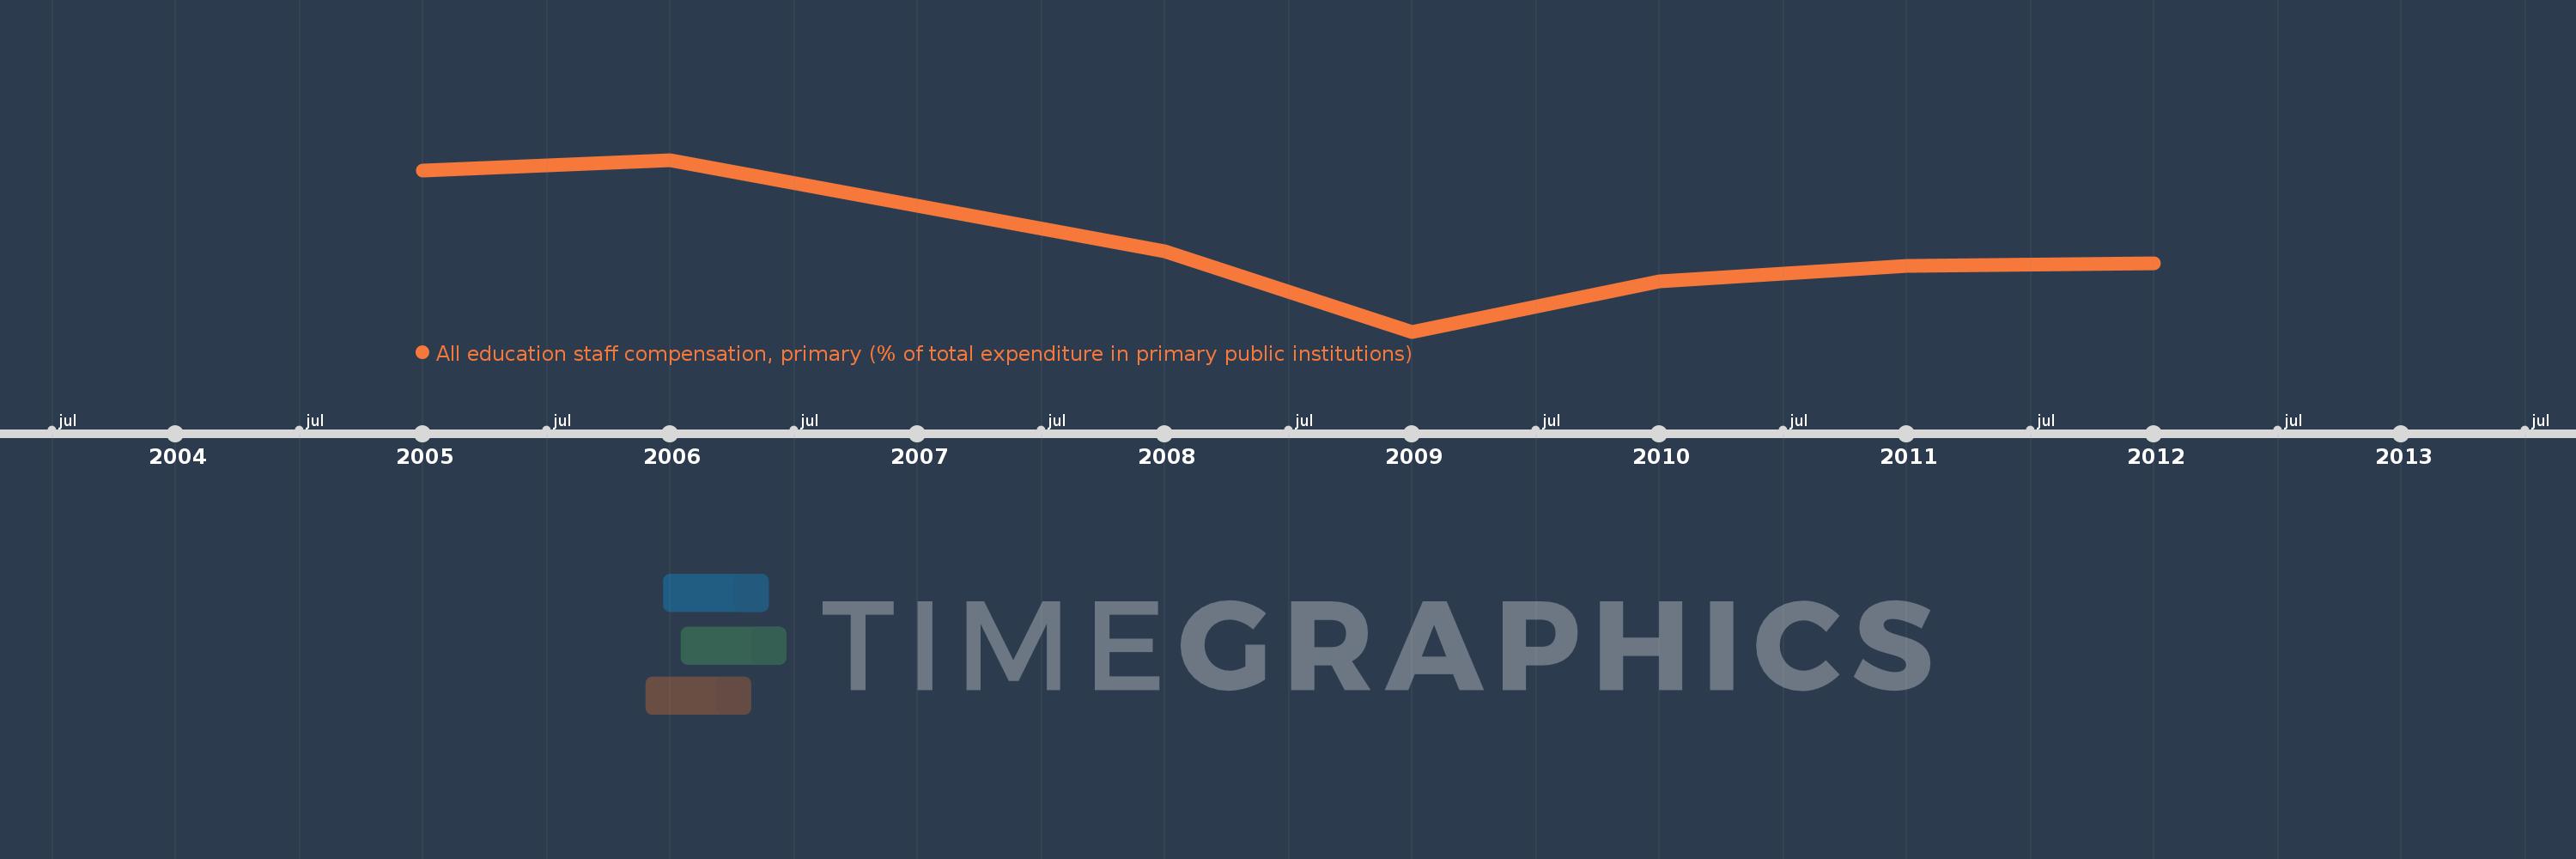
All education staff compensation, primary (% of total expenditure in primary public institutions)
2012,2011,2010,2009,2008,2006,2005
This statistics in other country:
Timeline:
This timeline shows a graph from 2005 to 2012 of Latin America & Caribbean (excluding high income). No data until 2004. Number of actual observations by date: 7.
Source name:
World Development Indicators
Source organization:
United Nations Educational, Scientific, and Cultural Organization (UNESCO) Institute for Statistics.
Categories, topics:
Education
Last updated:
apr 23, 2017
Indicators value changes by year
Minimum:
71.593
jan 1, 2009
Maximum:
88.402
jan 1, 2006
At the date of observation
Value
Absolute change
Change from previous value
jan 1, 2005
87.337
+87.337
0.0%
jan 1, 2006
88.402
+1.065
1.22%
jan 1, 2008
79.46
-8.942
-10.12%
jan 1, 2009
71.593
-7.867
-9.9%
jan 1, 2010
76.531
+4.938
6.9%
jan 1, 2011
78.057
+1.527
1.99%
jan 1, 2012
78.238
+0.181
0.23%
Ranking of countries by current statistics by years


Comments: