29
/
en
AIzaSyAYiBZKx7MnpbEhh9jyipgxe19OcubqV5w
April 1, 2024
197145
Moldova
MDA
true
2
1
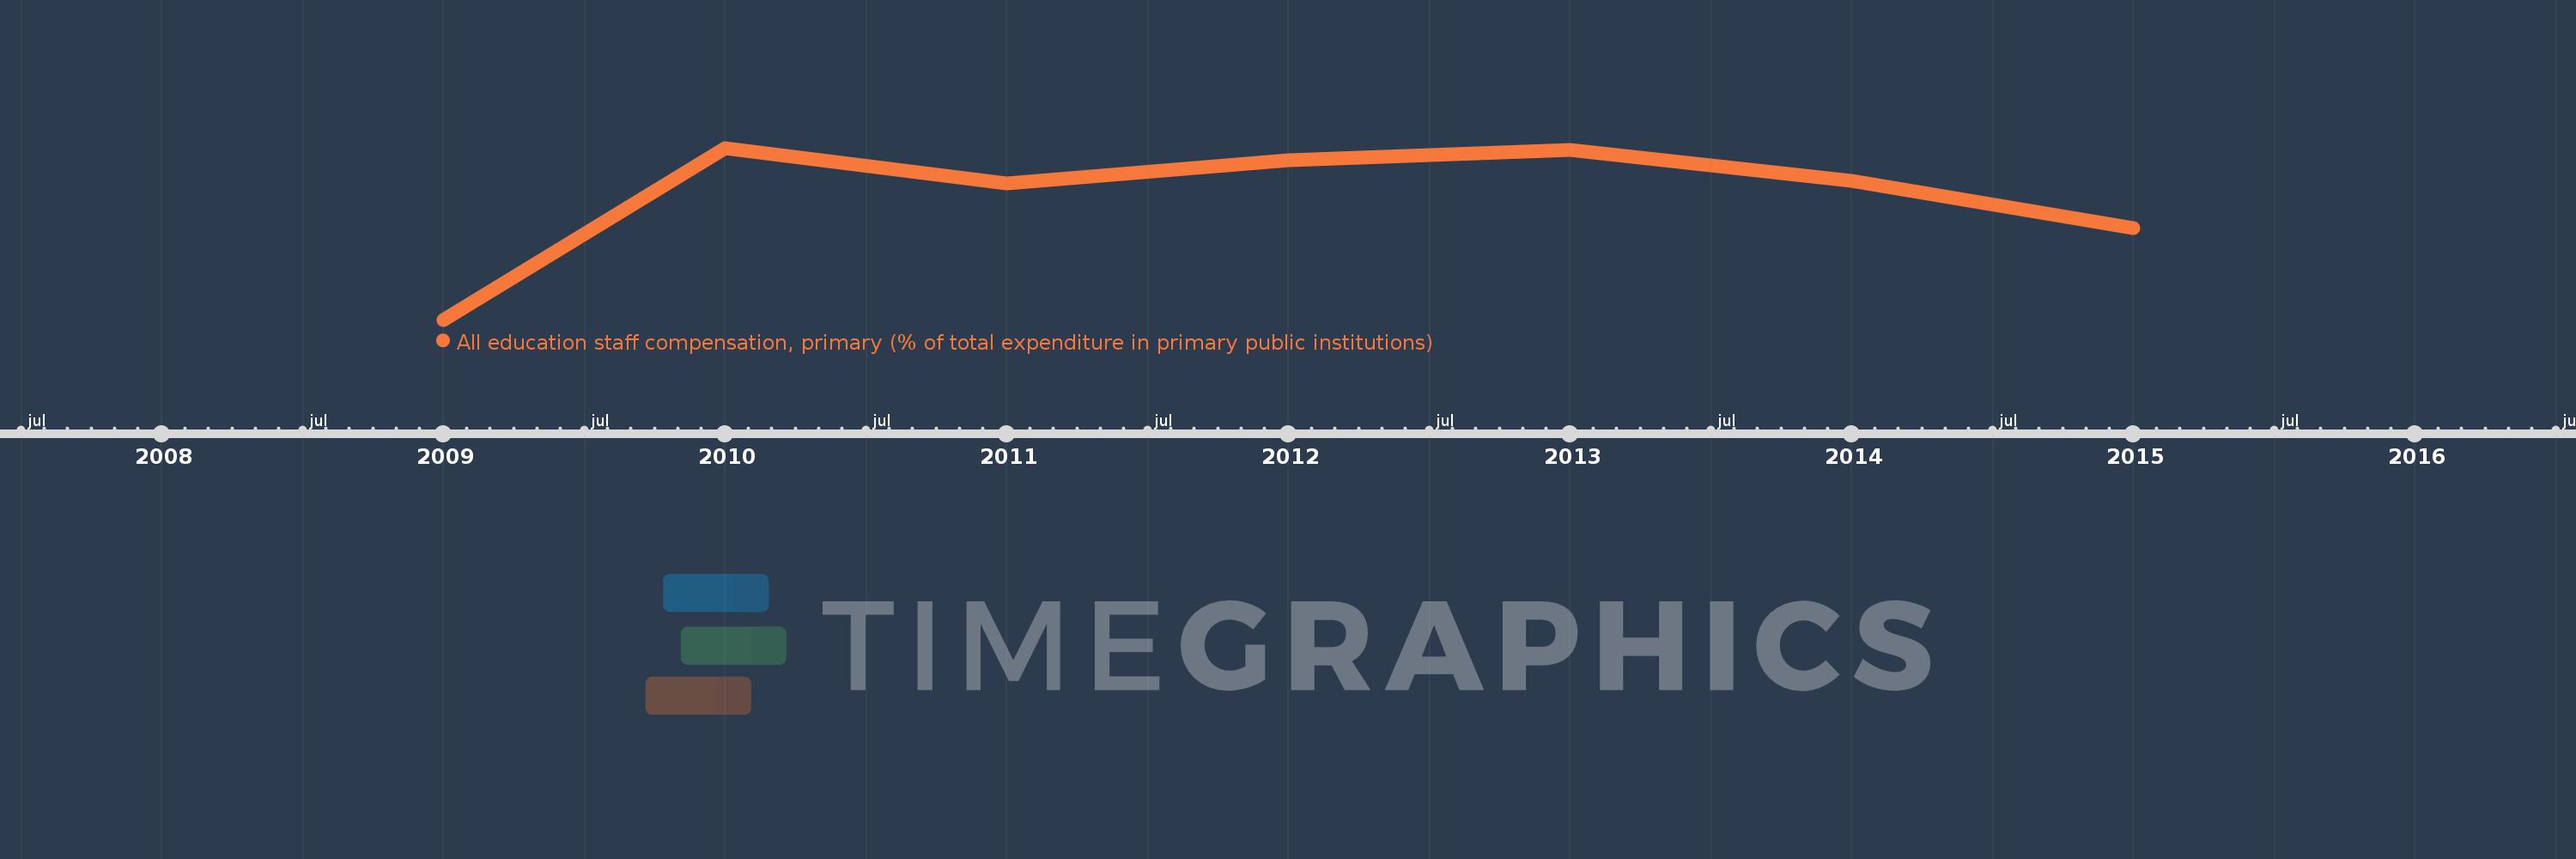
All education staff compensation, primary (% of total expenditure in primary public institutions)
2015,2014,2013,2012,2011,2010,2009
This statistics in other country:
Timeline:
This timeline shows a graph from 2009 to 2015 of Moldova. No data until 2008. Number of actual observations by date: 7.
Source name:
World Development Indicators
Source organization:
United Nations Educational, Scientific, and Cultural Organization (UNESCO) Institute for Statistics.
Categories, topics:
Education
Last updated:
apr 23, 2017
Indicators value changes by year
Minimum:
56.625
jan 1, 2009
Maximum:
65.218
jan 1, 2010
At the date of observation
Value
Absolute change
Change from previous value
jan 1, 2009
56.625
+56.625
0.0%
jan 1, 2010
65.218
+8.593
15.17%
jan 1, 2011
63.448
-1.77
-2.71%
jan 1, 2012
64.589
+1.141
1.8%
jan 1, 2013
65.138
+0.55
0.85%
jan 1, 2014
63.564
-1.574
-2.42%
jan 1, 2015
61.191
-2.374
-3.73%
Ranking of countries by current statistics by years


Comments: