29
/
en
AIzaSyAYiBZKx7MnpbEhh9jyipgxe19OcubqV5w
April 1, 2024
271098
Turks and Caicos Islands
TCA
true
2
1
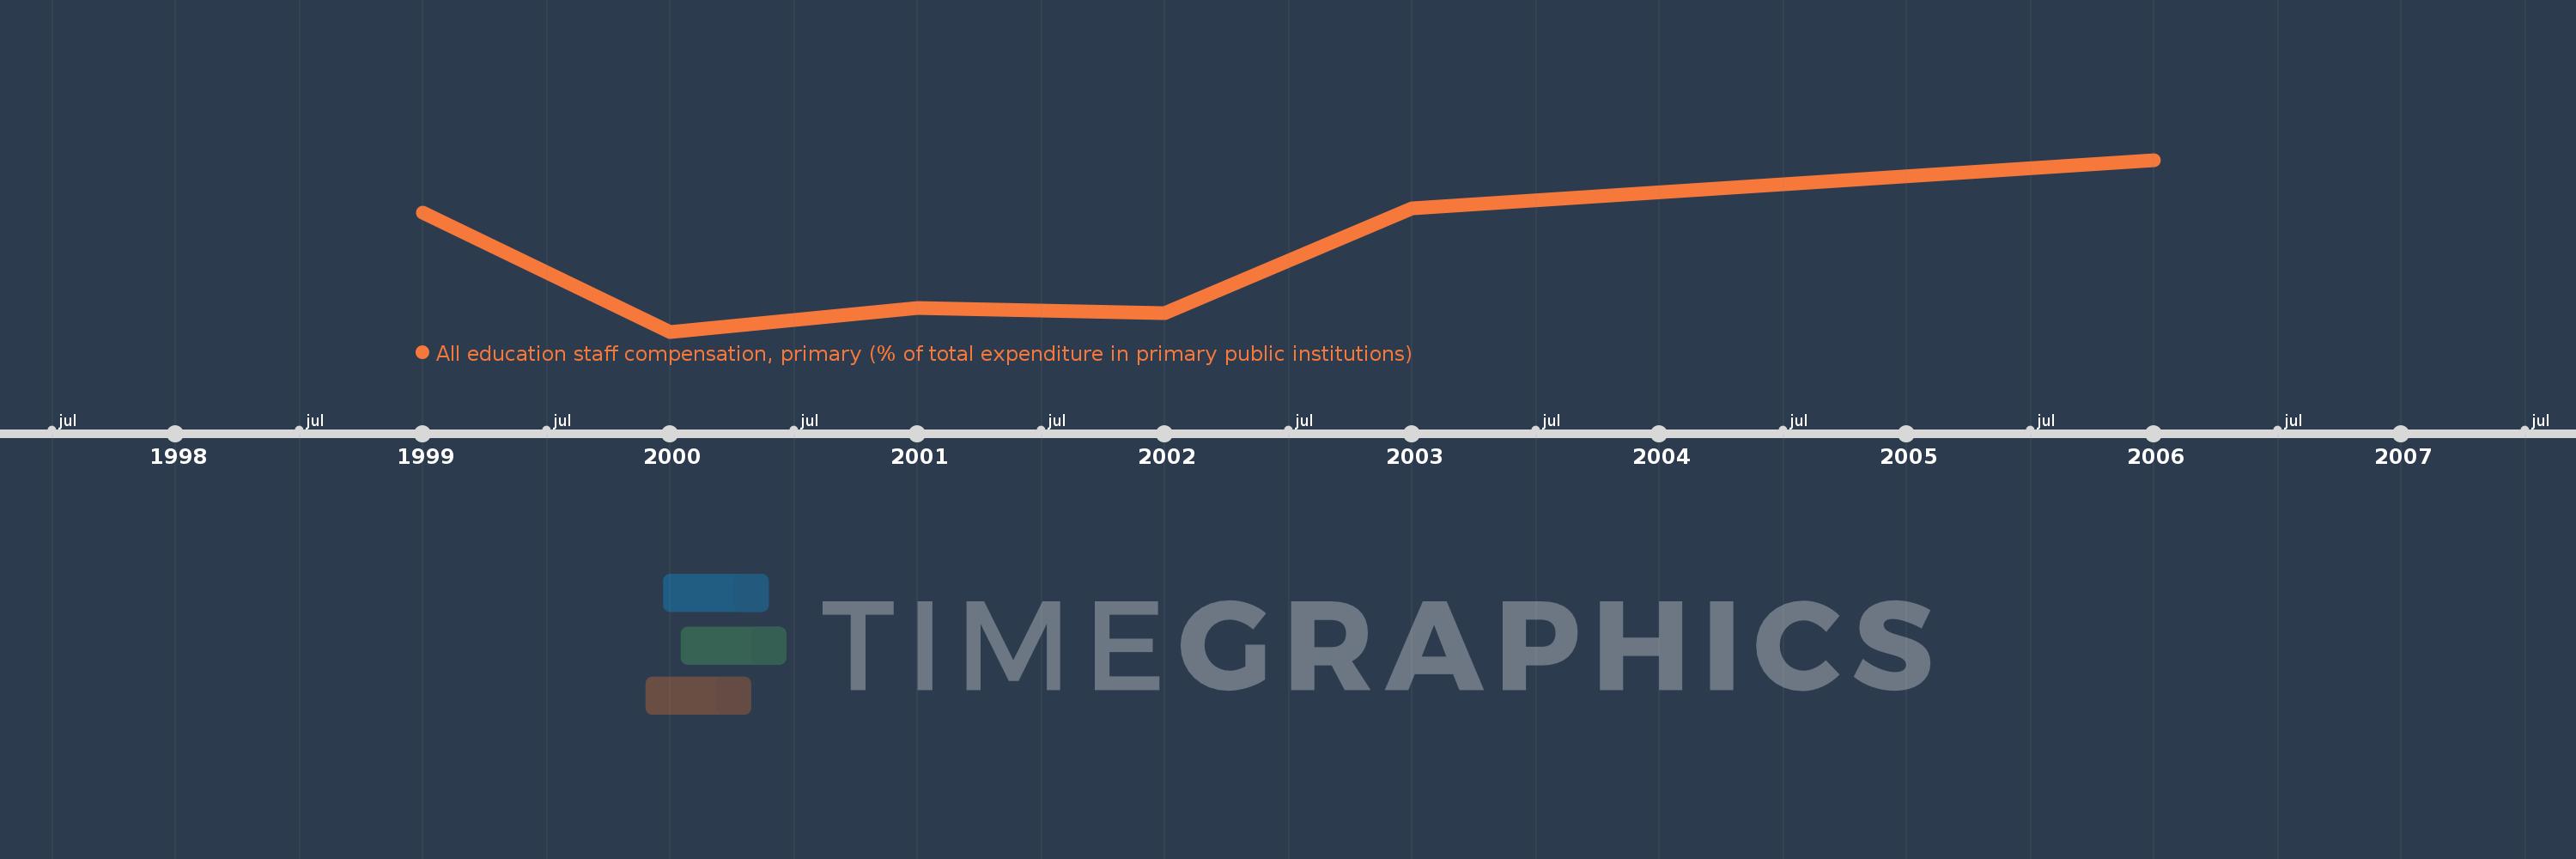
All education staff compensation, primary (% of total expenditure in primary public institutions)
2006,2003,2002,2001,2000,1999
This statistics in other country:
Timeline:
This timeline shows a graph from 1999 to 2006 of Turks and Caicos Islands. No data until 1998. Number of actual observations by date: 6.
Source name:
World Development Indicators
Source organization:
United Nations Educational, Scientific, and Cultural Organization (UNESCO) Institute for Statistics.
Categories, topics:
Education
Last updated:
apr 23, 2017
Indicators value changes by year
Minimum:
44.437
jan 1, 2000
At the date of observation
Value
Absolute change
Change from previous value
jan 1, 1999
72.222
+72.222
0.0%
jan 1, 2000
44.437
-27.785
-38.47%
jan 1, 2001
49.868
+5.431
12.22%
jan 1, 2002
48.805
-1.063
-2.13%
jan 1, 2003
73.092
+24.288
49.77%
jan 1, 2006
84.46
+11.367
15.55%
Ranking of countries by current statistics by years


Comments: