29
/
en
AIzaSyAYiBZKx7MnpbEhh9jyipgxe19OcubqV5w
April 1, 2024
67078
Andorra
AND
true
2
1
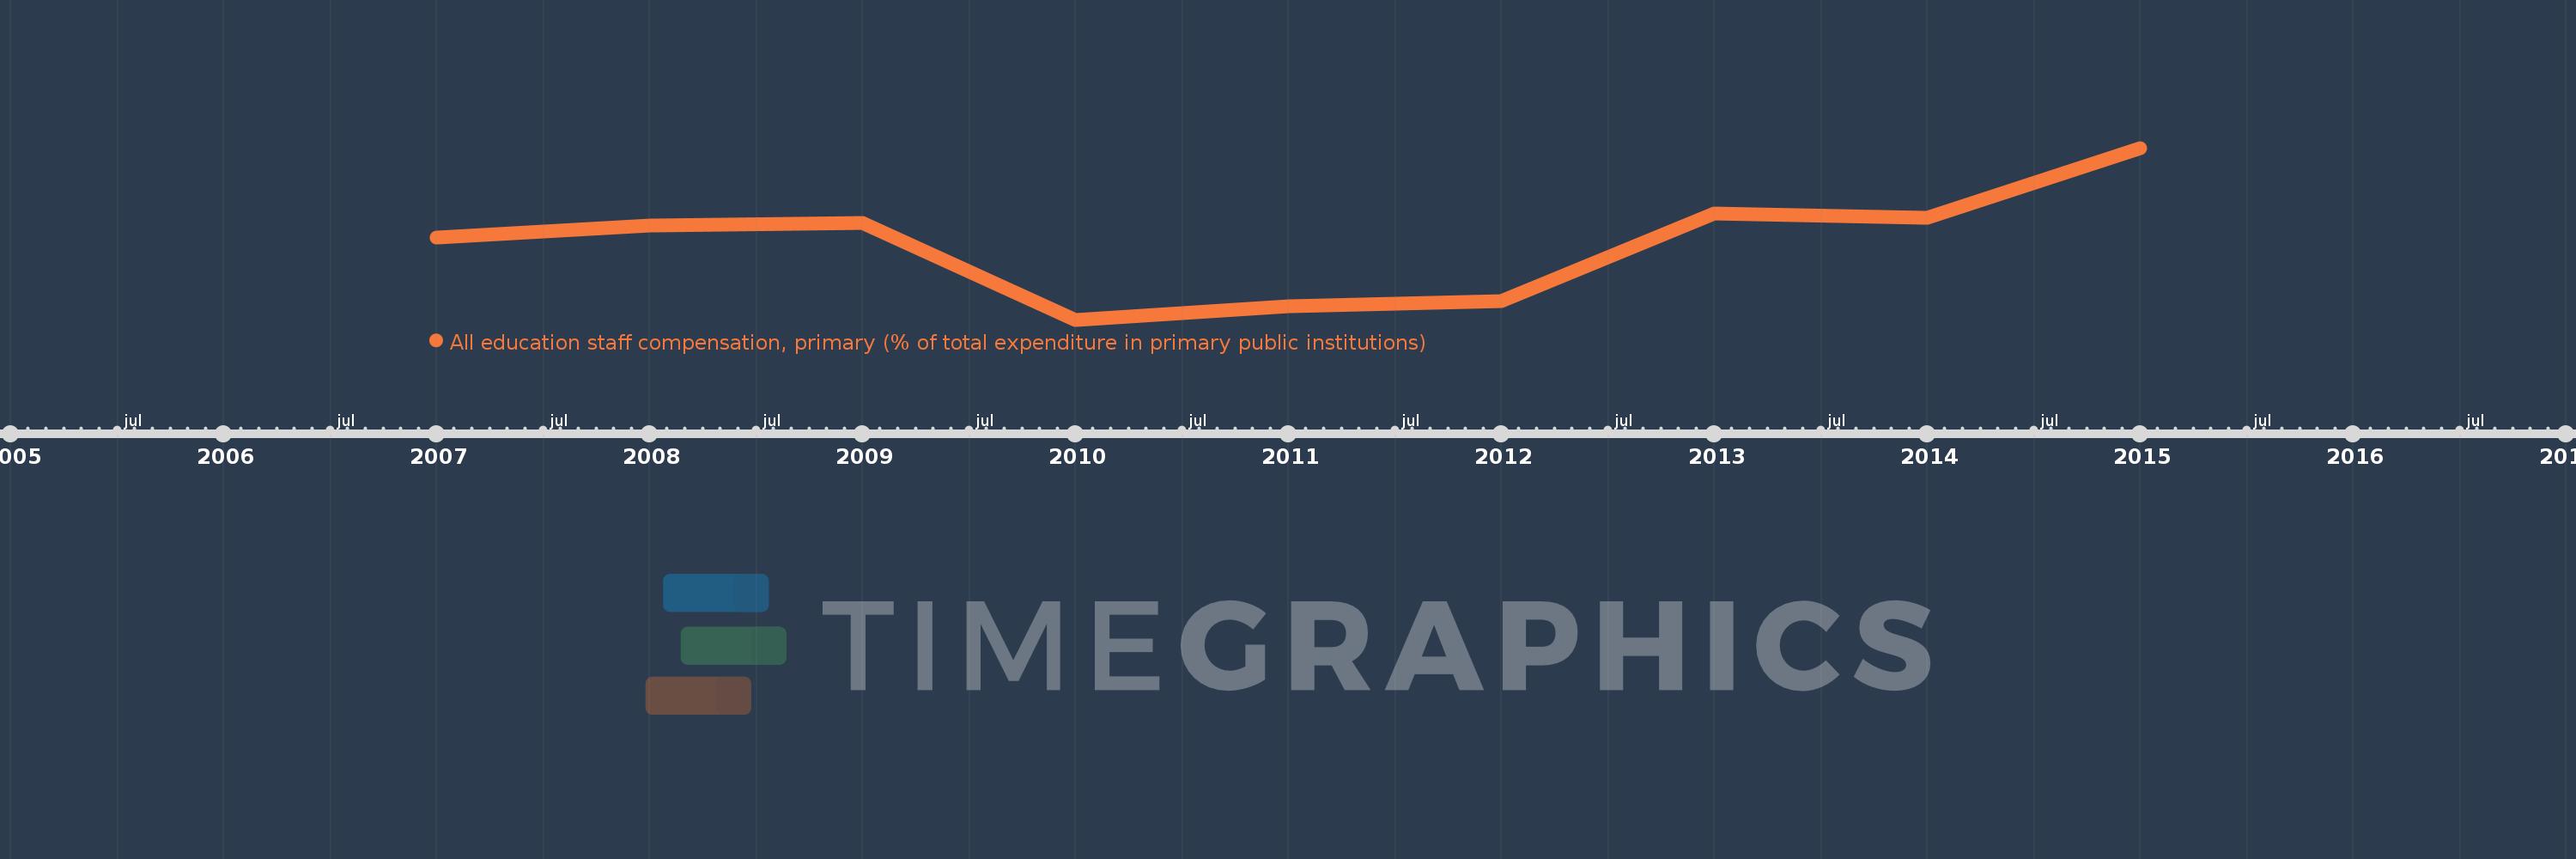
All education staff compensation, primary (% of total expenditure in primary public institutions)
2015,2014,2013,2012,2011,2010,2009,2008,2007
This statistics in other country:
Timeline:
This timeline shows a graph from 2007 to 2015 of Andorra. No data until 2006. Number of actual observations by date: 9.
Source name:
World Development Indicators
Source organization:
United Nations Educational, Scientific, and Cultural Organization (UNESCO) Institute for Statistics.
Categories, topics:
Education
Last updated:
apr 23, 2017
Indicators value changes by year
Minimum:
43.984
jan 1, 2010
Maximum:
62.159
jan 1, 2015
At the date of observation
Value
Absolute change
Change from previous value
jan 1, 2007
52.67
+52.67
0.0%
jan 1, 2008
53.933
+1.263
2.4%
jan 1, 2009
54.216
+0.284
0.53%
jan 1, 2010
43.984
-10.232
-18.87%
jan 1, 2011
45.434
+1.449
3.3%
jan 1, 2012
45.914
+0.481
1.06%
jan 1, 2013
55.255
+9.341
20.34%
jan 1, 2014
54.78
-0.475
-0.86%
jan 1, 2015
62.159
+7.379
13.47%
Ranking of countries by current statistics by years


Comments: