29
/
en
AIzaSyAYiBZKx7MnpbEhh9jyipgxe19OcubqV5w
April 1, 2024
187455
Malaysia
MYS
true
2
1
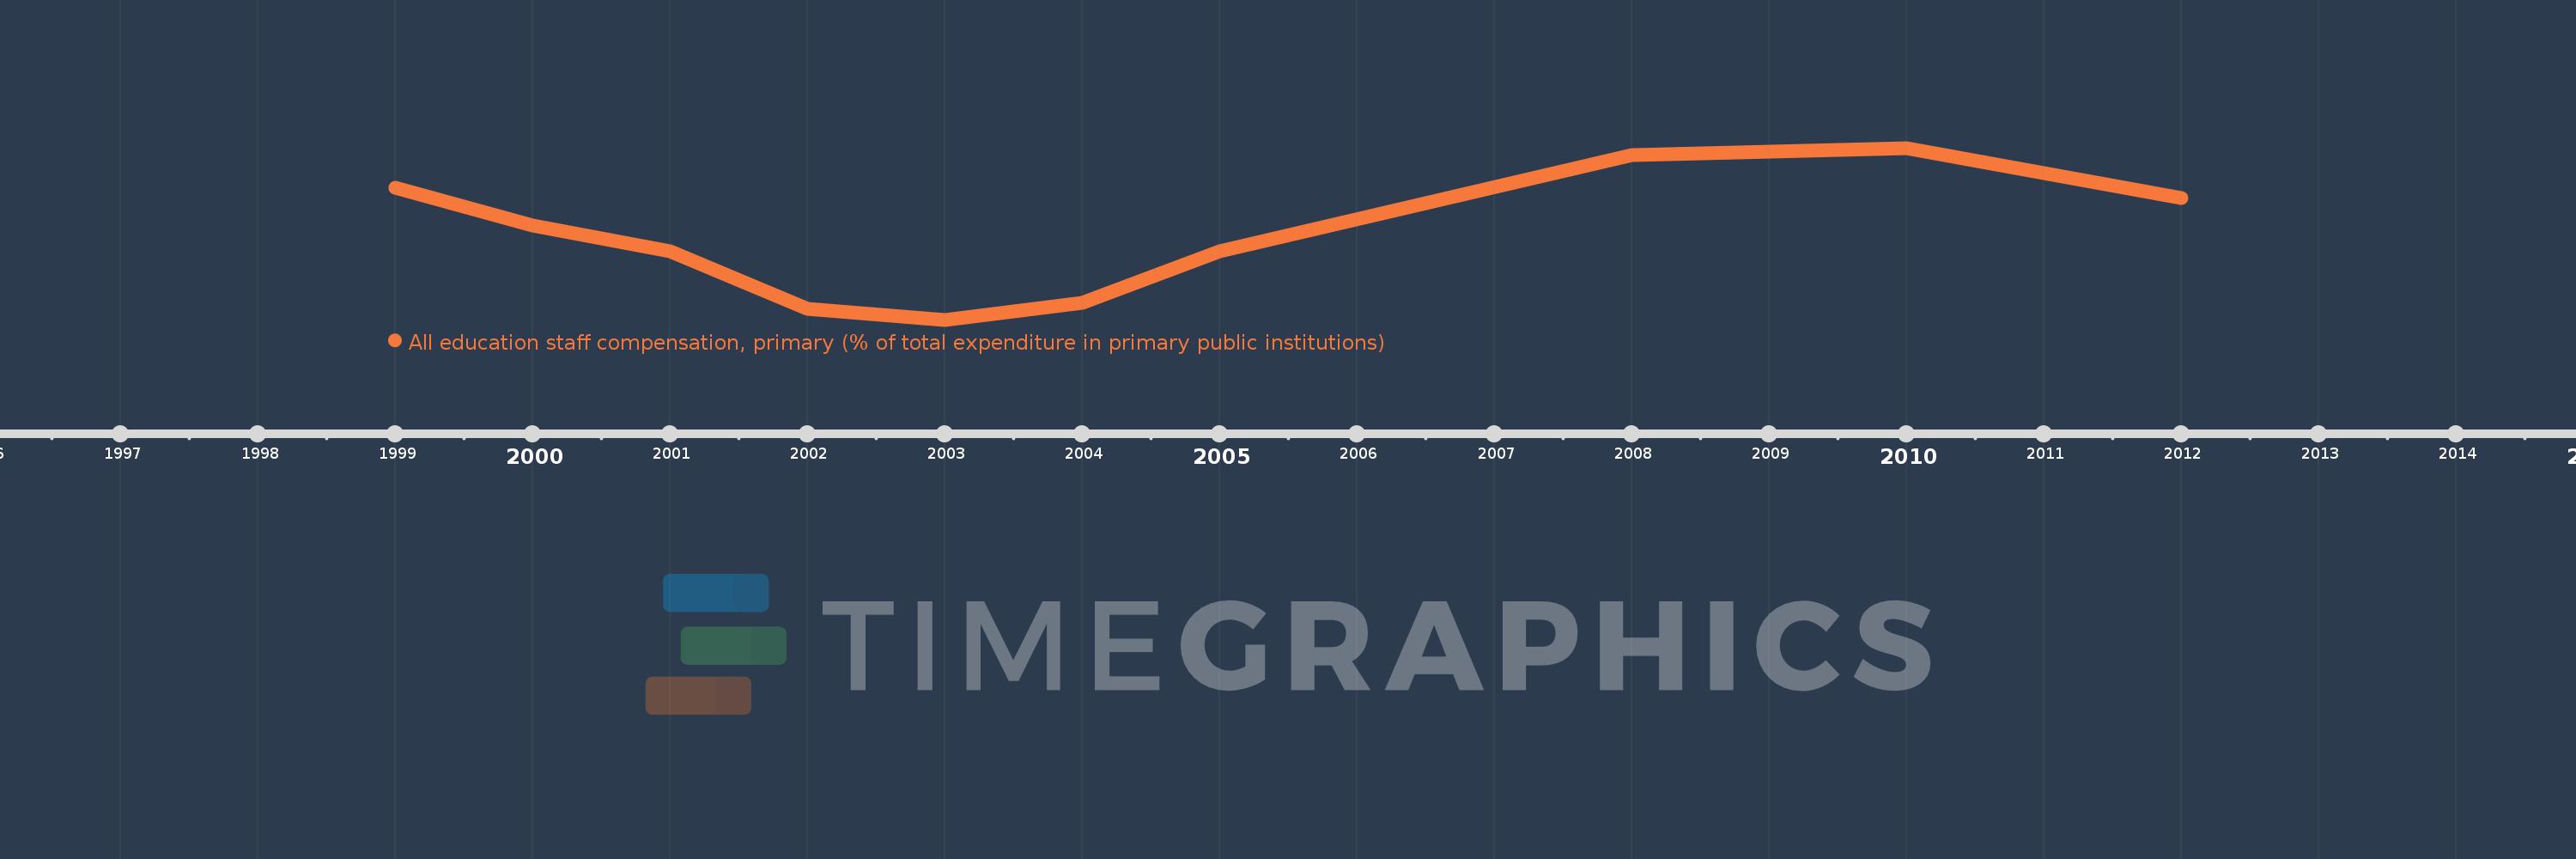
All education staff compensation, primary (% of total expenditure in primary public institutions)
2012,2010,2008,2005,2004,2003,2002,2001,2000,1999
This statistics in other country:
Timeline:
This timeline shows a graph from 1999 to 2012 of Malaysia. No data until 1998. Number of actual observations by date: 10.
Source name:
World Development Indicators
Source organization:
United Nations Educational, Scientific, and Cultural Organization (UNESCO) Institute for Statistics.
Categories, topics:
Education
Last updated:
apr 23, 2017
Indicators value changes by year
Minimum:
50.118
jan 1, 2003
Maximum:
86.624
jan 1, 2010
At the date of observation
Value
Absolute change
Change from previous value
jan 1, 1999
78.144
+78.144
0.0%
jan 1, 2000
70.228
-7.915
-10.13%
jan 1, 2001
64.673
-5.556
-7.91%
jan 1, 2002
52.459
-12.214
-18.89%
jan 1, 2003
50.118
-2.341
-4.46%
jan 1, 2004
53.707
+3.589
7.16%
jan 1, 2005
64.742
+11.035
20.55%
jan 1, 2008
85.102
+20.36
31.45%
jan 1, 2010
86.624
+1.522
1.79%
jan 1, 2012
76.022
-10.602
-12.24%
Ranking of countries by current statistics by years


Comments: