29
/
en
AIzaSyAYiBZKx7MnpbEhh9jyipgxe19OcubqV5w
April 1, 2024
191150
Malta
MLT
true
2
1
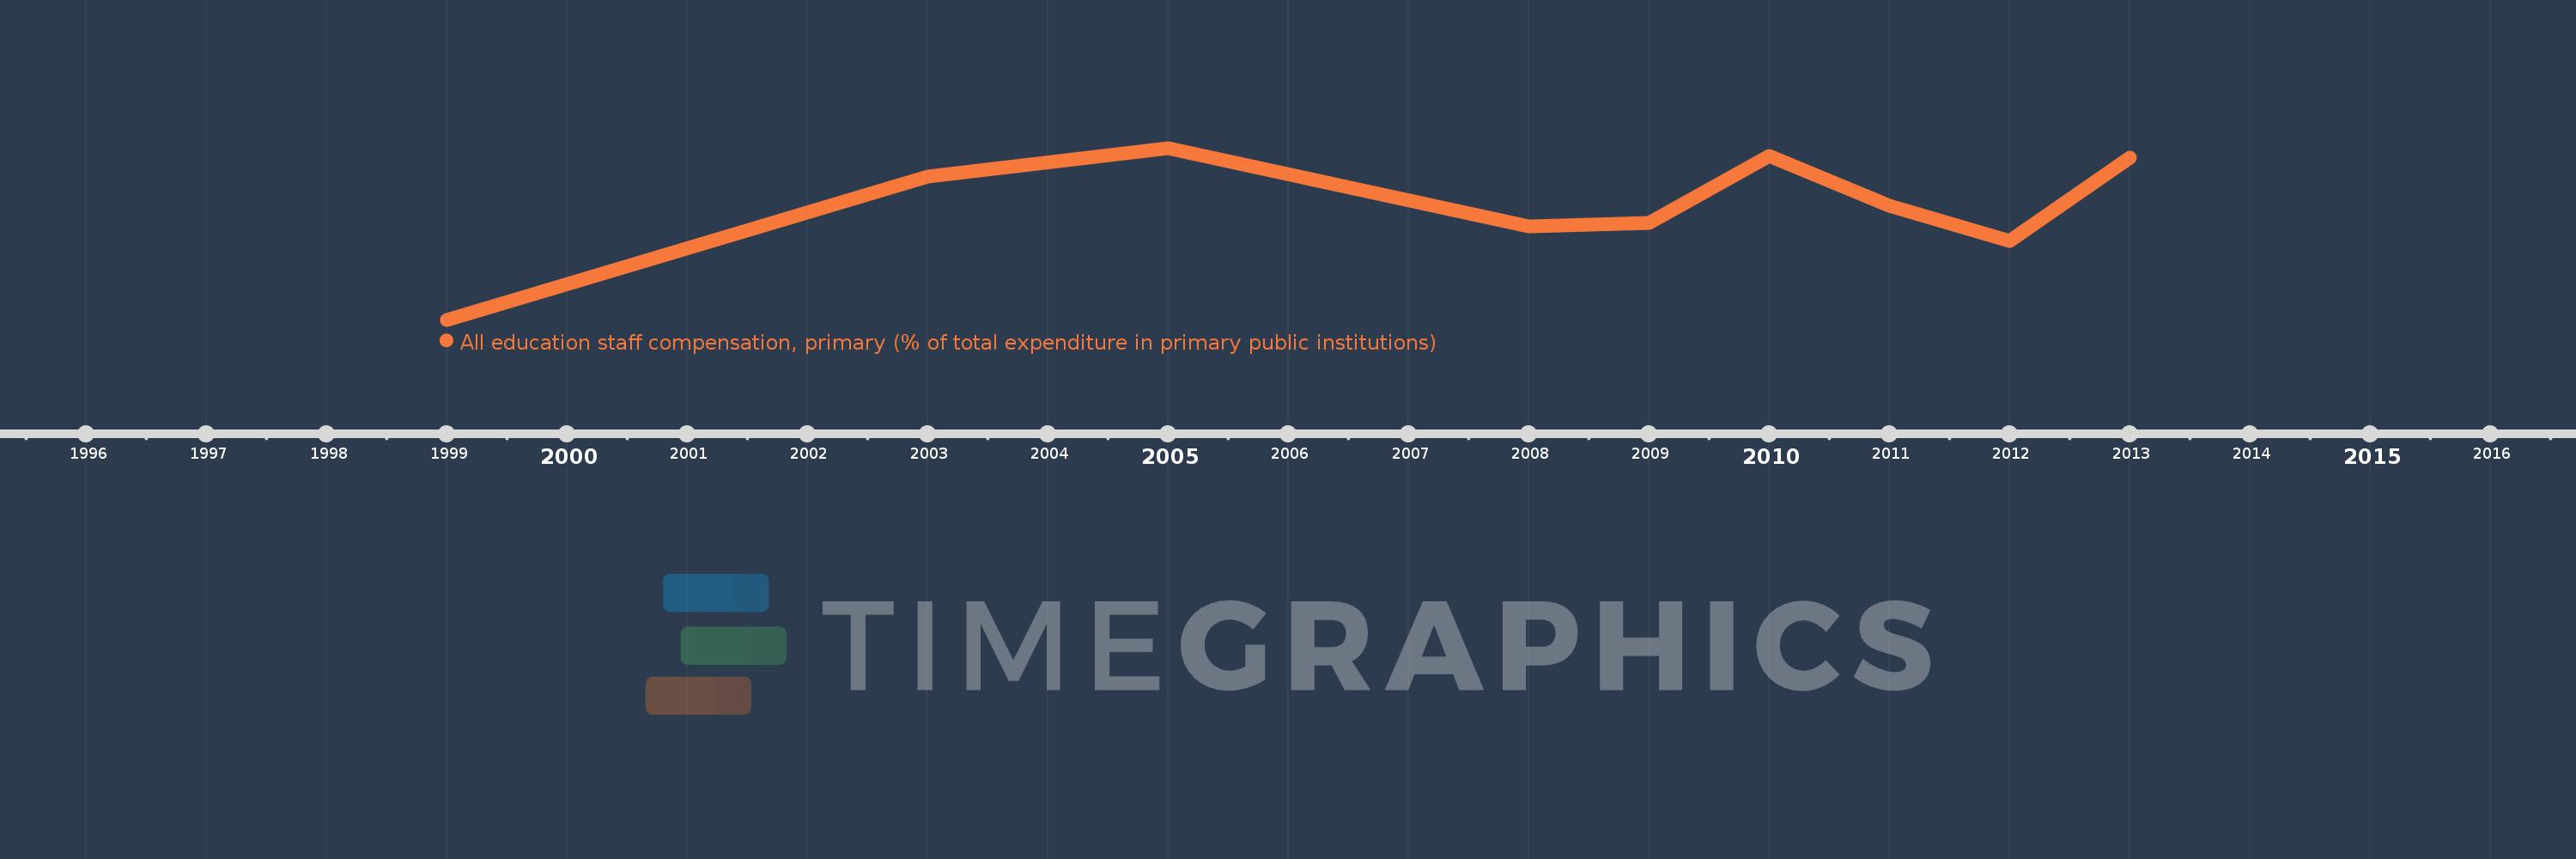
All education staff compensation, primary (% of total expenditure in primary public institutions)
2013,2012,2011,2010,2009,2008,2005,2003,1999
This statistics in other country:
Timeline:
This timeline shows a graph from 1999 to 2013 of Malta. No data until 1998. Number of actual observations by date: 9.
Source name:
World Development Indicators
Source organization:
United Nations Educational, Scientific, and Cultural Organization (UNESCO) Institute for Statistics.
Categories, topics:
Education
Last updated:
apr 23, 2017
Indicators value changes by year
Minimum:
72.917
jan 1, 1999
Maximum:
89.664
jan 1, 2005
At the date of observation
Value
Absolute change
Change from previous value
jan 1, 1999
72.917
+72.917
0.0%
jan 1, 2003
86.848
+13.931
19.1%
jan 1, 2005
89.664
+2.816
3.24%
jan 1, 2008
82.006
-7.658
-8.54%
jan 1, 2009
82.336
+0.33
0.4%
jan 1, 2010
88.853
+6.517
7.92%
jan 1, 2011
84.047
-4.807
-5.41%
jan 1, 2012
80.627
-3.419
-4.07%
jan 1, 2013
88.705
+8.078
10.02%
Ranking of countries by current statistics by years


Comments: