29
/
en
AIzaSyAYiBZKx7MnpbEhh9jyipgxe19OcubqV5w
April 1, 2024
96778
Burundi
BDI
true
2
1
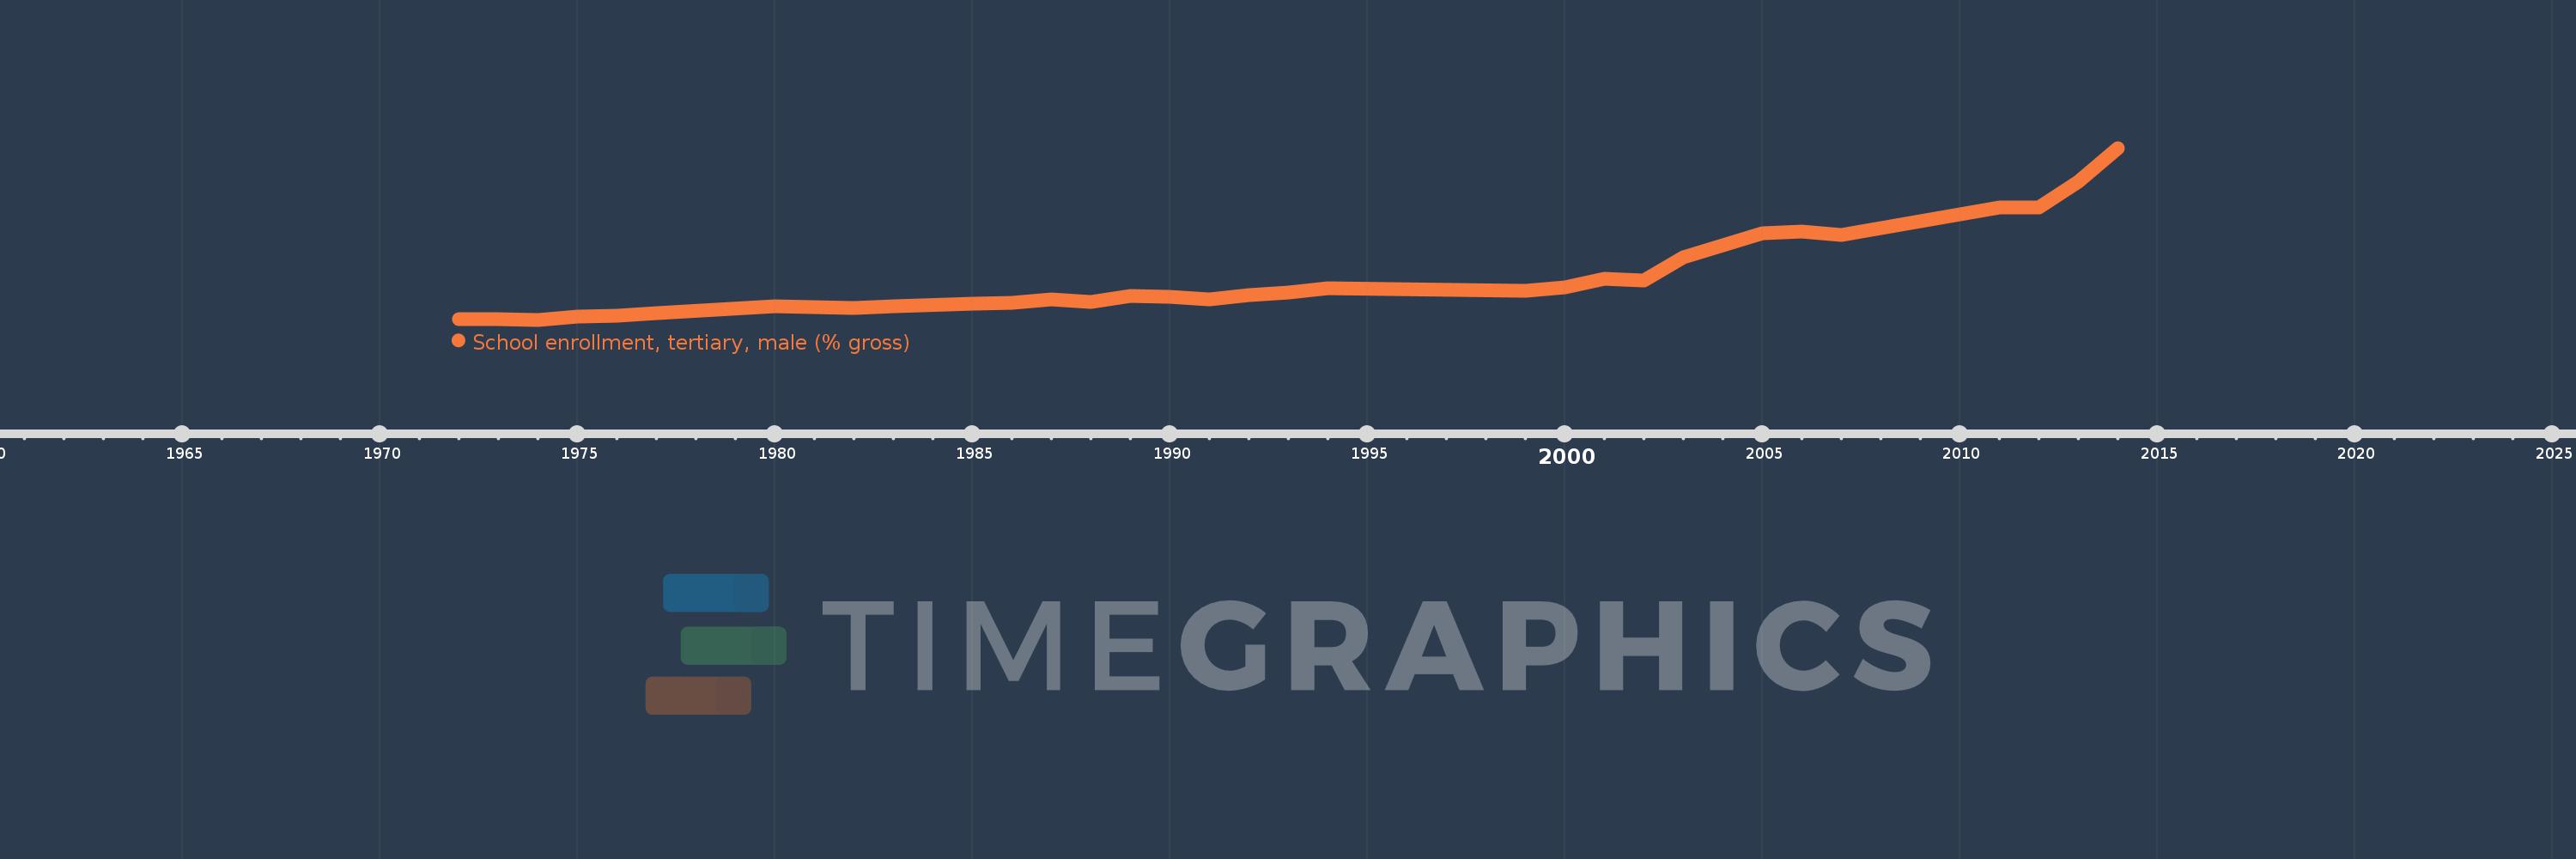
School enrollment, tertiary, male (% gross)
2014,2013,2012,2011,2007,2006,2005,2003,2002,2001,2000,1999,1994,1993,1992,1991,1990,1989,1988,1987,1986,1985,1983,1982,1981,1980,1977,1976,1975,1974,1973,1972
This statistics in other country:
AfghanistanAlbaniaAlgeriaAngolaAntigua and BarbudaArab WorldArgentinaArmeniaArubaAustraliaAustriaAzerbaijanBahamas, TheBahrainBangladeshBarbadosBelarusBelgiumBelizeBeninBermudaBhutanBoliviaBosnia and HerzegovinaBotswanaBrazilBrunei DarussalamBulgariaBurkina FasoBurundiCabo VerdeCambodiaCameroonCanadaCaribbean small statesCentral African RepublicCentral Europe and the BalticsChadChileChinaColombiaComorosCongo, Dem. Rep.Congo, Rep.Costa RicaCote d'IvoireCroatiaCubaCuracaoCyprusCzech RepublicDenmarkDjiboutiDominicaDominican RepublicEarly-demographic dividendEast Asia & PacificEast Asia & Pacific (excluding high income)East Asia & Pacific (IDA & IBRD countries)EcuadorEgypt, Arab Rep.El SalvadorEquatorial GuineaEritreaEstoniaEthiopiaEuro areaEurope & Central AsiaEurope & Central Asia (excluding high income)Europe & Central Asia (IDA & IBRD countries)European UnionFijiFinlandFragile and conflict affected situationsFranceGabonGambia, TheGeorgiaGermanyGhanaGreeceGrenadaGuatemalaGuineaGuinea-BissauGuyanaHaitiHeavily indebted poor countries (HIPC)High incomeHondurasHong Kong SAR, ChinaHungaryIBRD onlyIcelandIDA & IBRD totalIDA blendIDA onlyIDA totalIndiaIndonesiaIran, Islamic Rep.IraqIrelandIsraelItalyJamaicaJapanJordanKazakhstanKenyaKorea, Dem. People’s Rep.Korea, Rep.KuwaitKyrgyz RepublicLao PDRLate-demographic dividendLatin America & Caribbean Latin America & Caribbean (excluding high income)Latin America & the Caribbean (IDA & IBRD countries)LatviaLeast developed countries: UN classificationLebanonLesothoLiberiaLibyaLiechtensteinLithuaniaLow & middle incomeLow incomeLower middle incomeLuxembourgMacao SAR, ChinaMacedonia, FYRMadagascarMalawiMaldivesMaliMaltaMarshall IslandsMauritaniaMauritiusMexicoMicronesia, Fed. Sts.Middle East & North AfricaMiddle East & North Africa (excluding high income)Middle East & North Africa (IDA & IBRD countries)Middle incomeMoldovaMongoliaMontenegroMoroccoMozambiqueMyanmarNamibiaNepalNetherlandsNew ZealandNicaraguaNigerNigeriaNorth AmericaNorwayOECD membersOmanOther small statesPacific island small statesPakistanPalauPanamaPapua New GuineaParaguayPeruPhilippinesPolandPortugalPost-demographic dividendPre-demographic dividendPuerto RicoQatarRomaniaRussian FederationRwandaSamoaSan MarinoSao Tome and PrincipeSaudi ArabiaSenegalSerbiaSeychellesSierra LeoneSingaporeSlovak RepublicSloveniaSmall statesSomaliaSouth AfricaSouth AsiaSouth Asia (IDA & IBRD)SpainSri LankaSt. Kitts and NevisSt. LuciaSt. Vincent and the GrenadinesSub-Saharan Africa Sub-Saharan Africa (excluding high income)Sub-Saharan Africa (IDA & IBRD countries)SudanSurinameSwazilandSwedenSwitzerlandSyrian Arab RepublicTajikistanTanzaniaThailandTimor-LesteTogoTongaTrinidad and TobagoTunisiaTurkeyTurkmenistanUgandaUkraineUnited Arab EmiratesUnited KingdomUnited StatesUpper middle incomeUruguayUzbekistanVanuatuVenezuela, RBVietnamWest Bank and GazaWorldYemen, Rep.ZambiaZimbabwe Timeline:
This timeline shows a graph from 1972 to 2014 of Burundi. No data until 1971. Number of actual observations by date: 32.
Source name:
World Development Indicators
Source organization:
United Nations Educational, Scientific, and Cultural Organization (UNESCO) Institute for Statistics.
Categories, topics:
Education, Gender
Last updated:
apr 23, 2017
Indicators value changes by year
At the date of observation
Value
Absolute change
Change from previous value
jan 1, 1972
0.336
+0.336
0.0%
jan 1, 1973
0.337
+0.0
0.12%
jan 1, 1974
0.304
-0.033
-9.72%
jan 1, 1975
0.405
+0.101
33.31%
jan 1, 1976
0.455
+0.05
12.3%
jan 1, 1977
0.544
+0.089
19.45%
jan 1, 1980
0.779
+0.235
43.31%
jan 1, 1981
0.756
-0.023
-2.91%
jan 1, 1982
0.726
-0.03
-3.99%
jan 1, 1983
0.786
+0.06
8.29%
jan 1, 1985
0.862
+0.076
9.67%
jan 1, 1986
0.898
+0.036
4.13%
jan 1, 1987
1.004
+0.106
11.78%
jan 1, 1988
0.937
-0.067
-6.65%
jan 1, 1989
1.135
+0.198
21.12%
jan 1, 1990
1.105
-0.029
-2.59%
jan 1, 1991
1.002
-0.104
-9.4%
jan 1, 1992
1.167
+0.166
16.54%
jan 1, 1993
1.261
+0.094
8.02%
jan 1, 1994
1.415
+0.154
12.2%
jan 1, 1999
1.309
-0.105
-7.44%
jan 1, 2000
1.425
+0.115
8.8%
jan 1, 2001
1.719
+0.295
20.69%
jan 1, 2002
1.662
-0.057
-3.33%
jan 1, 2003
2.476
+0.814
48.95%
jan 1, 2005
3.326
+0.851
34.35%
jan 1, 2006
3.365
+0.039
1.17%
jan 1, 2007
3.243
-0.122
-3.62%
jan 1, 2011
4.202
+0.959
29.56%
jan 1, 2012
4.219
+0.017
0.4%
jan 1, 2013
5.099
+0.88
20.86%
jan 1, 2014
6.281
+1.181
23.17%
Ranking of countries by current statistics by years


Comments: