29
/
en
AIzaSyAYiBZKx7MnpbEhh9jyipgxe19OcubqV5w
April 1, 2024
40333
IDA total
IDA
false
2
1
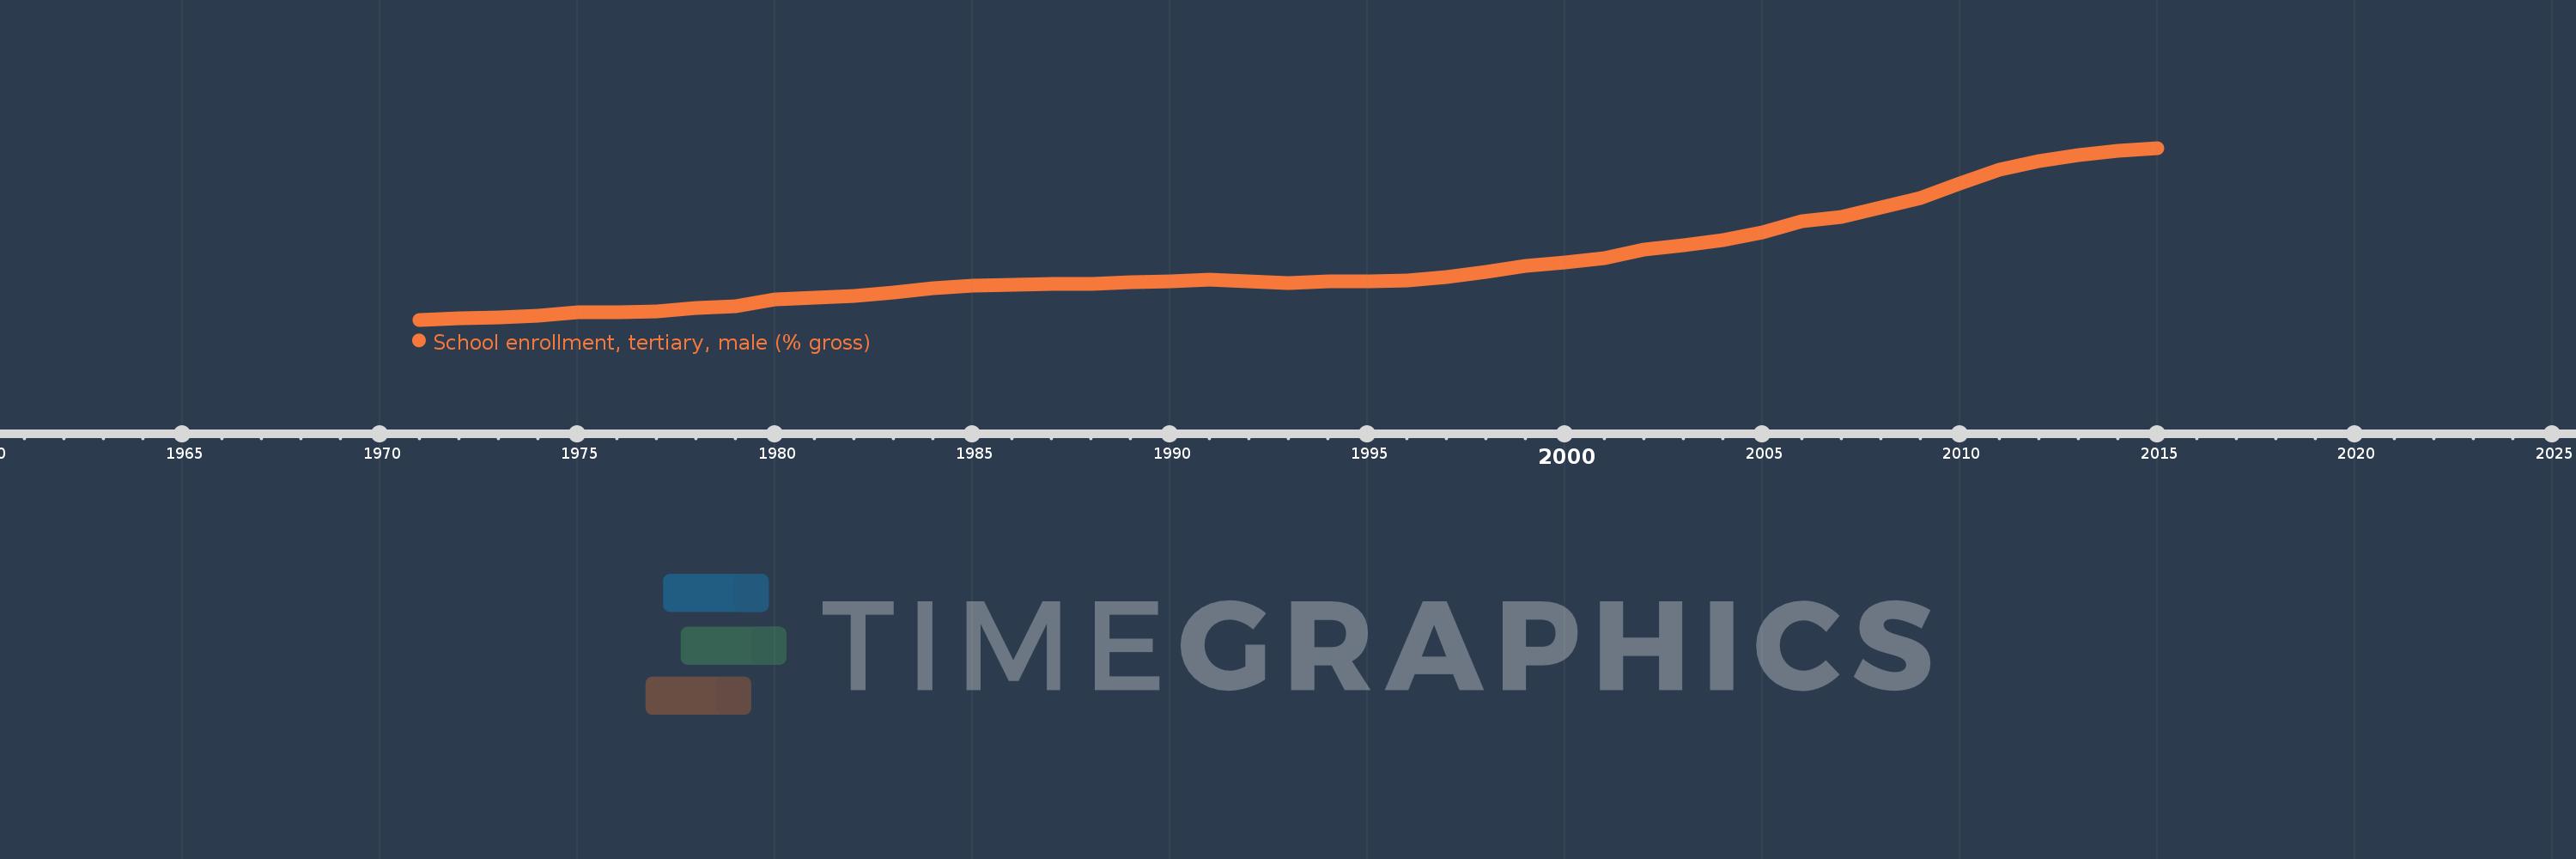
School enrollment, tertiary, male (% gross)
2015,2014,2013,2012,2011,2010,2009,2008,2007,2006,2005,2004,2003,2002,2001,2000,1999,1998,1997,1996,1995,1994,1993,1992,1991,1990,1989,1988,1987,1986,1985,1984,1983,1982,1981,1980,1979,1978,1977,1976,1975,1974,1973,1972,1971
This statistics in other country:
AfghanistanAlbaniaAlgeriaAngolaAntigua and BarbudaArab WorldArgentinaArmeniaArubaAustraliaAustriaAzerbaijanBahamas, TheBahrainBangladeshBarbadosBelarusBelgiumBelizeBeninBermudaBhutanBoliviaBosnia and HerzegovinaBotswanaBrazilBrunei DarussalamBulgariaBurkina FasoBurundiCabo VerdeCambodiaCameroonCanadaCaribbean small statesCentral African RepublicCentral Europe and the BalticsChadChileChinaColombiaComorosCongo, Dem. Rep.Congo, Rep.Costa RicaCote d'IvoireCroatiaCubaCuracaoCyprusCzech RepublicDenmarkDjiboutiDominicaDominican RepublicEarly-demographic dividendEast Asia & PacificEast Asia & Pacific (excluding high income)East Asia & Pacific (IDA & IBRD countries)EcuadorEgypt, Arab Rep.El SalvadorEquatorial GuineaEritreaEstoniaEthiopiaEuro areaEurope & Central AsiaEurope & Central Asia (excluding high income)Europe & Central Asia (IDA & IBRD countries)European UnionFijiFinlandFragile and conflict affected situationsFranceGabonGambia, TheGeorgiaGermanyGhanaGreeceGrenadaGuatemalaGuineaGuinea-BissauGuyanaHaitiHeavily indebted poor countries (HIPC)High incomeHondurasHong Kong SAR, ChinaHungaryIBRD onlyIcelandIDA & IBRD totalIDA blendIDA onlyIDA totalIndiaIndonesiaIran, Islamic Rep.IraqIrelandIsraelItalyJamaicaJapanJordanKazakhstanKenyaKorea, Dem. People’s Rep.Korea, Rep.KuwaitKyrgyz RepublicLao PDRLate-demographic dividendLatin America & Caribbean Latin America & Caribbean (excluding high income)Latin America & the Caribbean (IDA & IBRD countries)LatviaLeast developed countries: UN classificationLebanonLesothoLiberiaLibyaLiechtensteinLithuaniaLow & middle incomeLow incomeLower middle incomeLuxembourgMacao SAR, ChinaMacedonia, FYRMadagascarMalawiMaldivesMaliMaltaMarshall IslandsMauritaniaMauritiusMexicoMicronesia, Fed. Sts.Middle East & North AfricaMiddle East & North Africa (excluding high income)Middle East & North Africa (IDA & IBRD countries)Middle incomeMoldovaMongoliaMontenegroMoroccoMozambiqueMyanmarNamibiaNepalNetherlandsNew ZealandNicaraguaNigerNigeriaNorth AmericaNorwayOECD membersOmanOther small statesPacific island small statesPakistanPalauPanamaPapua New GuineaParaguayPeruPhilippinesPolandPortugalPost-demographic dividendPre-demographic dividendPuerto RicoQatarRomaniaRussian FederationRwandaSamoaSan MarinoSao Tome and PrincipeSaudi ArabiaSenegalSerbiaSeychellesSierra LeoneSingaporeSlovak RepublicSloveniaSmall statesSomaliaSouth AfricaSouth AsiaSouth Asia (IDA & IBRD)SpainSri LankaSt. Kitts and NevisSt. LuciaSt. Vincent and the GrenadinesSub-Saharan Africa Sub-Saharan Africa (excluding high income)Sub-Saharan Africa (IDA & IBRD countries)SudanSurinameSwazilandSwedenSwitzerlandSyrian Arab RepublicTajikistanTanzaniaThailandTimor-LesteTogoTongaTrinidad and TobagoTunisiaTurkeyTurkmenistanUgandaUkraineUnited Arab EmiratesUnited KingdomUnited StatesUpper middle incomeUruguayUzbekistanVanuatuVenezuela, RBVietnamWest Bank and GazaWorldYemen, Rep.ZambiaZimbabwe Timeline:
This timeline shows a graph from 1971 to 2015 of IDA total. No data until 1970. Number of actual observations by date: 45.
Source name:
World Development Indicators
Source organization:
United Nations Educational, Scientific, and Cultural Organization (UNESCO) Institute for Statistics.
Categories, topics:
Education, Gender
Last updated:
apr 23, 2017
Indicators value changes by year
Maximum:
12.572
jan 1, 2015
At the date of observation
Value
Absolute change
Change from previous value
jan 1, 1971
2.861
+2.861
0.0%
jan 1, 1972
2.925
+0.064
2.24%
jan 1, 1973
2.988
+0.063
2.15%
jan 1, 1974
3.077
+0.088
2.96%
jan 1, 1975
3.292
+0.216
7.02%
jan 1, 1976
3.291
-0.002
-0.05%
jan 1, 1977
3.319
+0.028
0.84%
jan 1, 1978
3.514
+0.196
5.9%
jan 1, 1979
3.62
+0.106
3.0%
jan 1, 1980
4.025
+0.405
11.19%
jan 1, 1981
4.112
+0.087
2.16%
jan 1, 1982
4.215
+0.104
2.52%
jan 1, 1983
4.396
+0.181
4.28%
jan 1, 1984
4.638
+0.242
5.51%
jan 1, 1985
4.777
+0.139
3.0%
jan 1, 1986
4.836
+0.059
1.24%
jan 1, 1987
4.894
+0.057
1.19%
jan 1, 1988
4.889
-0.004
-0.09%
jan 1, 1989
4.973
+0.084
1.72%
jan 1, 1990
5.037
+0.063
1.28%
jan 1, 1991
5.133
+0.096
1.91%
jan 1, 1992
5.035
-0.098
-1.91%
jan 1, 1993
4.931
-0.104
-2.06%
jan 1, 1994
5.018
+0.087
1.76%
jan 1, 1995
5.021
+0.003
0.07%
jan 1, 1996
5.083
+0.062
1.24%
jan 1, 1997
5.25
+0.167
3.28%
jan 1, 1998
5.564
+0.314
5.97%
jan 1, 1999
5.902
+0.338
6.08%
jan 1, 2000
6.089
+0.187
3.17%
jan 1, 2001
6.345
+0.256
4.2%
jan 1, 2002
6.835
+0.49
7.73%
jan 1, 2003
7.092
+0.256
3.75%
jan 1, 2004
7.368
+0.276
3.9%
jan 1, 2005
7.801
+0.433
5.87%
jan 1, 2006
8.445
+0.645
8.26%
jan 1, 2007
8.69
+0.245
2.9%
jan 1, 2008
9.187
+0.497
5.71%
jan 1, 2009
9.726
+0.539
5.86%
jan 1, 2010
10.55
+0.825
8.48%
jan 1, 2011
11.344
+0.794
7.52%
jan 1, 2012
11.817
+0.473
4.17%
jan 1, 2013
12.166
+0.349
2.95%
jan 1, 2014
12.395
+0.229
1.89%
jan 1, 2015
12.572
+0.177
1.43%
Ranking of countries by current statistics by years


Comments: