29
/
en
AIzaSyAYiBZKx7MnpbEhh9jyipgxe19OcubqV5w
April 1, 2024
261596
Tanzania
TZA
true
2
1
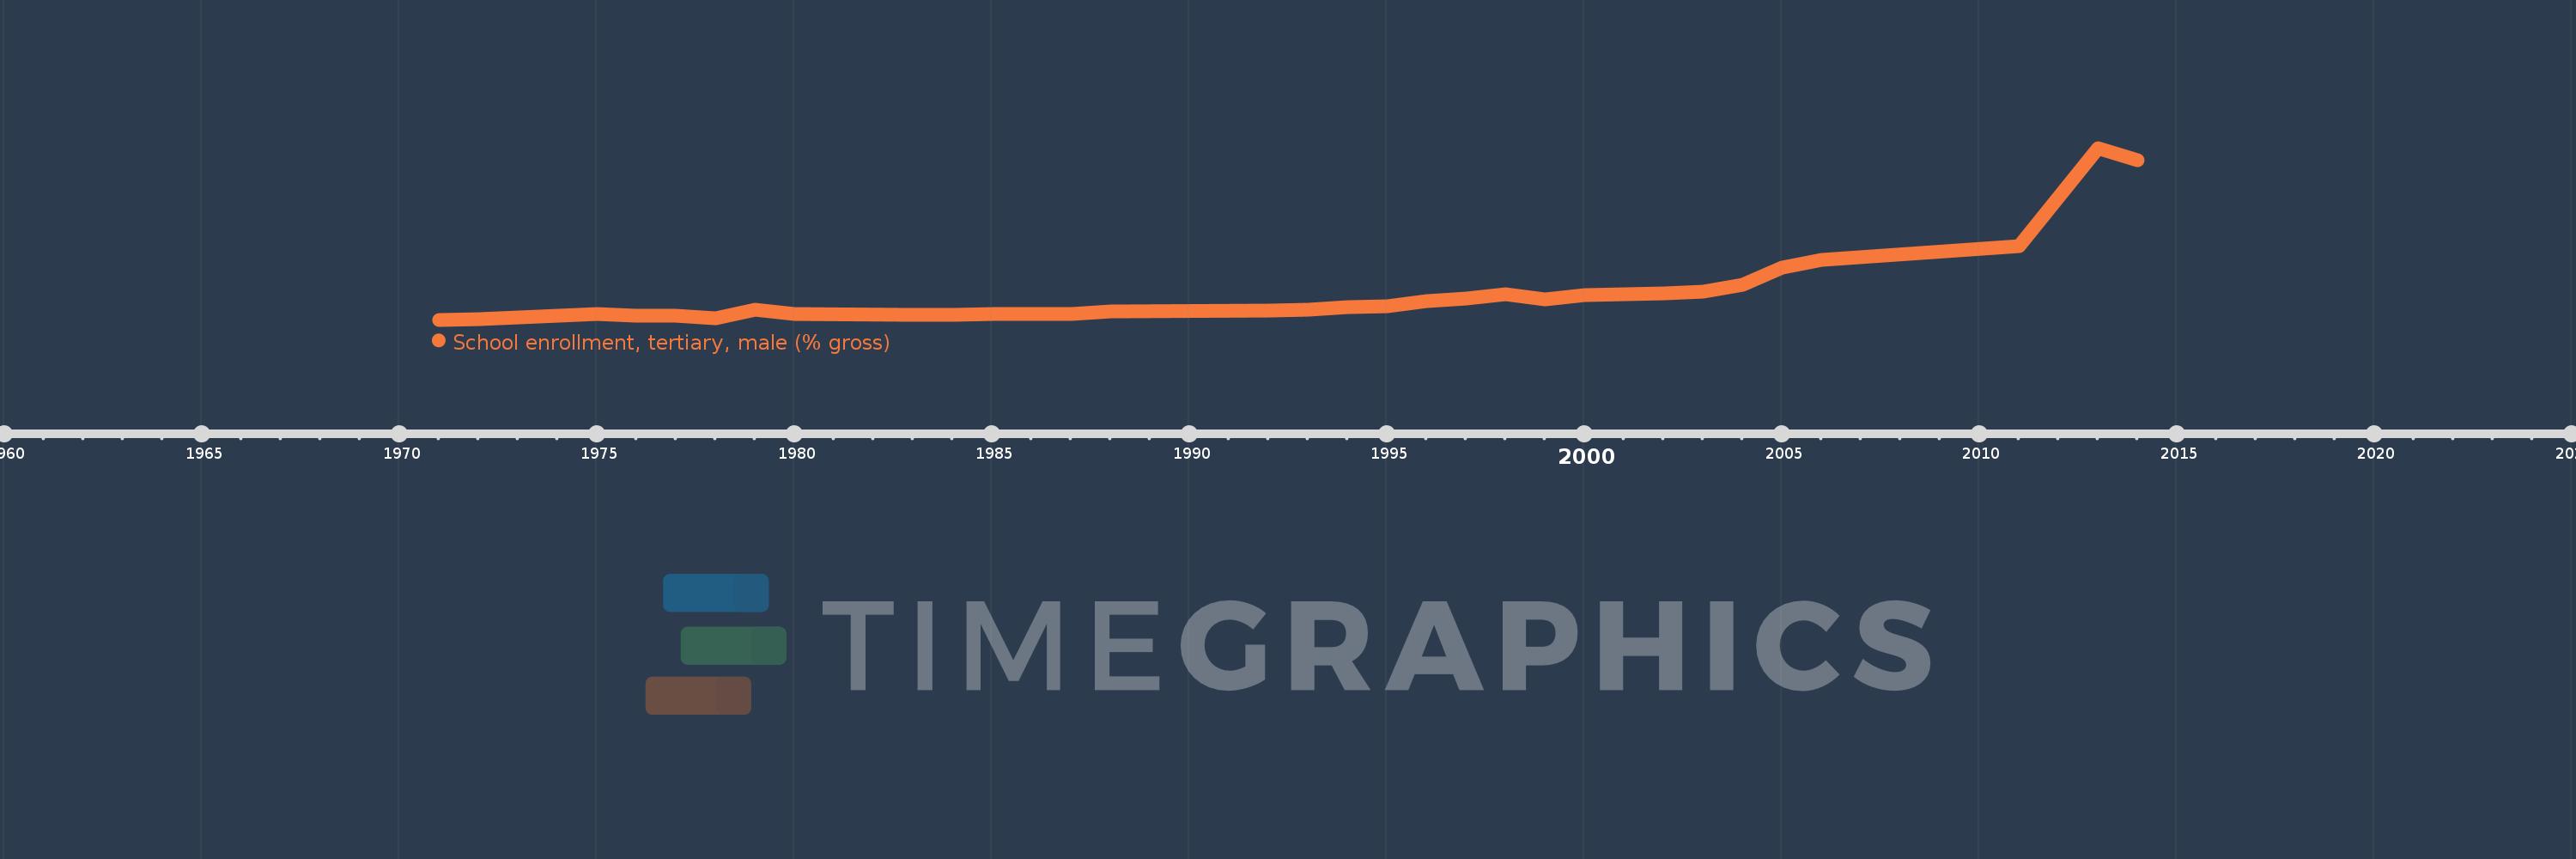
School enrollment, tertiary, male (% gross)
2014,2013,2011,2006,2005,2004,2003,2002,2001,2000,1999,1998,1997,1996,1995,1994,1993,1992,1988,1987,1986,1985,1984,1983,1980,1979,1978,1977,1976,1975,1974,1973,1972,1971
This statistics in other country:
AfghanistanAlbaniaAlgeriaAngolaAntigua and BarbudaArab WorldArgentinaArmeniaArubaAustraliaAustriaAzerbaijanBahamas, TheBahrainBangladeshBarbadosBelarusBelgiumBelizeBeninBermudaBhutanBoliviaBosnia and HerzegovinaBotswanaBrazilBrunei DarussalamBulgariaBurkina FasoBurundiCabo VerdeCambodiaCameroonCanadaCaribbean small statesCentral African RepublicCentral Europe and the BalticsChadChileChinaColombiaComorosCongo, Dem. Rep.Congo, Rep.Costa RicaCote d'IvoireCroatiaCubaCuracaoCyprusCzech RepublicDenmarkDjiboutiDominicaDominican RepublicEarly-demographic dividendEast Asia & PacificEast Asia & Pacific (excluding high income)East Asia & Pacific (IDA & IBRD countries)EcuadorEgypt, Arab Rep.El SalvadorEquatorial GuineaEritreaEstoniaEthiopiaEuro areaEurope & Central AsiaEurope & Central Asia (excluding high income)Europe & Central Asia (IDA & IBRD countries)European UnionFijiFinlandFragile and conflict affected situationsFranceGabonGambia, TheGeorgiaGermanyGhanaGreeceGrenadaGuatemalaGuineaGuinea-BissauGuyanaHaitiHeavily indebted poor countries (HIPC)High incomeHondurasHong Kong SAR, ChinaHungaryIBRD onlyIcelandIDA & IBRD totalIDA blendIDA onlyIDA totalIndiaIndonesiaIran, Islamic Rep.IraqIrelandIsraelItalyJamaicaJapanJordanKazakhstanKenyaKorea, Dem. People’s Rep.Korea, Rep.KuwaitKyrgyz RepublicLao PDRLate-demographic dividendLatin America & Caribbean Latin America & Caribbean (excluding high income)Latin America & the Caribbean (IDA & IBRD countries)LatviaLeast developed countries: UN classificationLebanonLesothoLiberiaLibyaLiechtensteinLithuaniaLow & middle incomeLow incomeLower middle incomeLuxembourgMacao SAR, ChinaMacedonia, FYRMadagascarMalawiMaldivesMaliMaltaMarshall IslandsMauritaniaMauritiusMexicoMicronesia, Fed. Sts.Middle East & North AfricaMiddle East & North Africa (excluding high income)Middle East & North Africa (IDA & IBRD countries)Middle incomeMoldovaMongoliaMontenegroMoroccoMozambiqueMyanmarNamibiaNepalNetherlandsNew ZealandNicaraguaNigerNigeriaNorth AmericaNorwayOECD membersOmanOther small statesPacific island small statesPakistanPalauPanamaPapua New GuineaParaguayPeruPhilippinesPolandPortugalPost-demographic dividendPre-demographic dividendPuerto RicoQatarRomaniaRussian FederationRwandaSamoaSan MarinoSao Tome and PrincipeSaudi ArabiaSenegalSerbiaSeychellesSierra LeoneSingaporeSlovak RepublicSloveniaSmall statesSomaliaSouth AfricaSouth AsiaSouth Asia (IDA & IBRD)SpainSri LankaSt. Kitts and NevisSt. LuciaSt. Vincent and the GrenadinesSub-Saharan Africa Sub-Saharan Africa (excluding high income)Sub-Saharan Africa (IDA & IBRD countries)SudanSurinameSwazilandSwedenSwitzerlandSyrian Arab RepublicTajikistanTanzaniaThailandTimor-LesteTogoTongaTrinidad and TobagoTunisiaTurkeyTurkmenistanUgandaUkraineUnited Arab EmiratesUnited KingdomUnited StatesUpper middle incomeUruguayUzbekistanVanuatuVenezuela, RBVietnamWest Bank and GazaWorldYemen, Rep.ZambiaZimbabwe Timeline:
This timeline shows a graph from 1971 to 2014 of Tanzania. No data until 1970. Number of actual observations by date: 34.
Source name:
World Development Indicators
Source organization:
United Nations Educational, Scientific, and Cultural Organization (UNESCO) Institute for Statistics.
Categories, topics:
Education, Gender
Last updated:
apr 23, 2017
Indicators value changes by year
At the date of observation
Value
Absolute change
Change from previous value
jan 1, 1971
0.297
+0.297
0.0%
jan 1, 1972
0.312
+0.014
4.75%
jan 1, 1973
0.372
+0.06
19.34%
jan 1, 1974
0.406
+0.034
9.12%
jan 1, 1975
0.457
+0.051
12.58%
jan 1, 1976
0.406
-0.051
-11.16%
jan 1, 1977
0.425
+0.02
4.83%
jan 1, 1978
0.331
-0.094
-22.13%
jan 1, 1979
0.582
+0.251
75.83%
jan 1, 1980
0.45
-0.133
-22.81%
jan 1, 1983
0.437
-0.013
-2.88%
jan 1, 1984
0.441
+0.004
0.92%
jan 1, 1985
0.458
+0.017
3.89%
jan 1, 1986
0.455
-0.003
-0.59%
jan 1, 1987
0.455
0.0
0.0%
jan 1, 1988
0.544
+0.089
19.49%
jan 1, 1992
0.561
+0.018
3.24%
jan 1, 1993
0.576
+0.014
2.56%
jan 1, 1994
0.657
+0.081
14.09%
jan 1, 1995
0.69
+0.033
5.09%
jan 1, 1996
0.822
+0.132
19.11%
jan 1, 1997
0.908
+0.086
10.46%
jan 1, 1998
1.025
+0.117
12.83%
jan 1, 1999
0.881
-0.143
-13.98%
jan 1, 2000
1.001
+0.119
13.55%
jan 1, 2001
1.036
+0.036
3.55%
jan 1, 2002
1.055
+0.019
1.82%
jan 1, 2003
1.091
+0.035
3.36%
jan 1, 2004
1.296
+0.205
18.79%
jan 1, 2005
1.793
+0.498
38.41%
jan 1, 2006
2.008
+0.215
11.97%
jan 1, 2011
2.4
+0.392
19.54%
jan 1, 2013
5.225
+2.825
117.7%
jan 1, 2014
4.868
-0.357
-6.83%
Ranking of countries by current statistics by years


Comments: