29
/
en
AIzaSyAYiBZKx7MnpbEhh9jyipgxe19OcubqV5w
April 1, 2024
36993
IBRD only
IBD
false
2
1
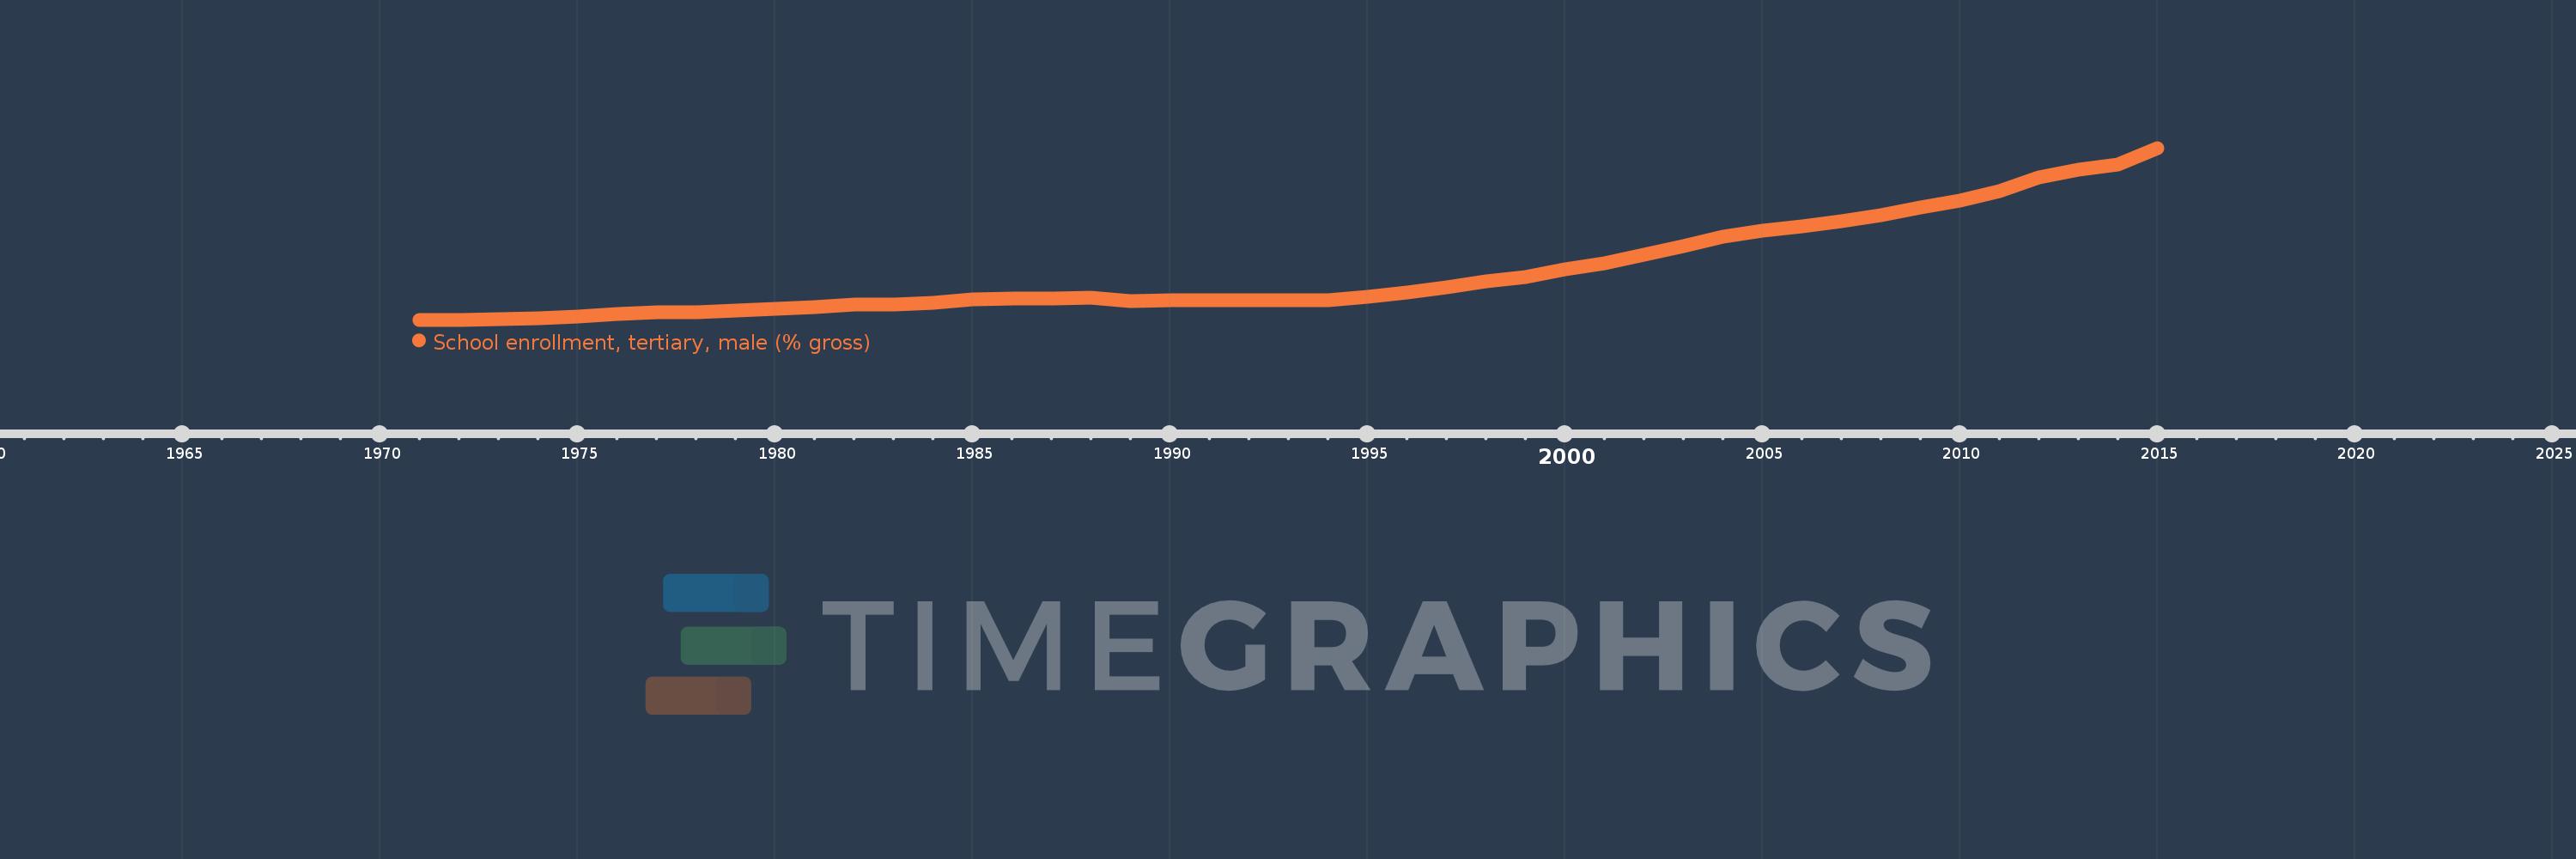
School enrollment, tertiary, male (% gross)
2015,2014,2013,2012,2011,2010,2009,2008,2007,2006,2005,2004,2003,2002,2001,2000,1999,1998,1997,1996,1995,1994,1993,1992,1991,1990,1989,1988,1987,1986,1985,1984,1983,1982,1981,1980,1979,1978,1977,1976,1975,1974,1973,1972,1971
This statistics in other country:
AfghanistanAlbaniaAlgeriaAngolaAntigua and BarbudaArab WorldArgentinaArmeniaArubaAustraliaAustriaAzerbaijanBahamas, TheBahrainBangladeshBarbadosBelarusBelgiumBelizeBeninBermudaBhutanBoliviaBosnia and HerzegovinaBotswanaBrazilBrunei DarussalamBulgariaBurkina FasoBurundiCabo VerdeCambodiaCameroonCanadaCaribbean small statesCentral African RepublicCentral Europe and the BalticsChadChileChinaColombiaComorosCongo, Dem. Rep.Congo, Rep.Costa RicaCote d'IvoireCroatiaCubaCuracaoCyprusCzech RepublicDenmarkDjiboutiDominicaDominican RepublicEarly-demographic dividendEast Asia & PacificEast Asia & Pacific (excluding high income)East Asia & Pacific (IDA & IBRD countries)EcuadorEgypt, Arab Rep.El SalvadorEquatorial GuineaEritreaEstoniaEthiopiaEuro areaEurope & Central AsiaEurope & Central Asia (excluding high income)Europe & Central Asia (IDA & IBRD countries)European UnionFijiFinlandFragile and conflict affected situationsFranceGabonGambia, TheGeorgiaGermanyGhanaGreeceGrenadaGuatemalaGuineaGuinea-BissauGuyanaHaitiHeavily indebted poor countries (HIPC)High incomeHondurasHong Kong SAR, ChinaHungaryIBRD onlyIcelandIDA & IBRD totalIDA blendIDA onlyIDA totalIndiaIndonesiaIran, Islamic Rep.IraqIrelandIsraelItalyJamaicaJapanJordanKazakhstanKenyaKorea, Dem. People’s Rep.Korea, Rep.KuwaitKyrgyz RepublicLao PDRLate-demographic dividendLatin America & Caribbean Latin America & Caribbean (excluding high income)Latin America & the Caribbean (IDA & IBRD countries)LatviaLeast developed countries: UN classificationLebanonLesothoLiberiaLibyaLiechtensteinLithuaniaLow & middle incomeLow incomeLower middle incomeLuxembourgMacao SAR, ChinaMacedonia, FYRMadagascarMalawiMaldivesMaliMaltaMarshall IslandsMauritaniaMauritiusMexicoMicronesia, Fed. Sts.Middle East & North AfricaMiddle East & North Africa (excluding high income)Middle East & North Africa (IDA & IBRD countries)Middle incomeMoldovaMongoliaMontenegroMoroccoMozambiqueMyanmarNamibiaNepalNetherlandsNew ZealandNicaraguaNigerNigeriaNorth AmericaNorwayOECD membersOmanOther small statesPacific island small statesPakistanPalauPanamaPapua New GuineaParaguayPeruPhilippinesPolandPortugalPost-demographic dividendPre-demographic dividendPuerto RicoQatarRomaniaRussian FederationRwandaSamoaSan MarinoSao Tome and PrincipeSaudi ArabiaSenegalSerbiaSeychellesSierra LeoneSingaporeSlovak RepublicSloveniaSmall statesSomaliaSouth AfricaSouth AsiaSouth Asia (IDA & IBRD)SpainSri LankaSt. Kitts and NevisSt. LuciaSt. Vincent and the GrenadinesSub-Saharan Africa Sub-Saharan Africa (excluding high income)Sub-Saharan Africa (IDA & IBRD countries)SudanSurinameSwazilandSwedenSwitzerlandSyrian Arab RepublicTajikistanTanzaniaThailandTimor-LesteTogoTongaTrinidad and TobagoTunisiaTurkeyTurkmenistanUgandaUkraineUnited Arab EmiratesUnited KingdomUnited StatesUpper middle incomeUruguayUzbekistanVanuatuVenezuela, RBVietnamWest Bank and GazaWorldYemen, Rep.ZambiaZimbabwe Timeline:
This timeline shows a graph from 1971 to 2015 of IBRD only. No data until 1970. Number of actual observations by date: 45.
Source name:
World Development Indicators
Source organization:
United Nations Educational, Scientific, and Cultural Organization (UNESCO) Institute for Statistics.
Categories, topics:
Education, Gender
Last updated:
apr 23, 2017
Indicators value changes by year
Maximum:
34.575
jan 1, 2015
At the date of observation
Value
Absolute change
Change from previous value
jan 1, 1971
7.491
+7.491
0.0%
jan 1, 1972
7.493
+0.003
0.04%
jan 1, 1973
7.549
+0.056
0.74%
jan 1, 1974
7.705
+0.156
2.07%
jan 1, 1975
7.981
+0.276
3.58%
jan 1, 1976
8.365
+0.383
4.8%
jan 1, 1977
8.62
+0.255
3.05%
jan 1, 1978
8.702
+0.082
0.96%
jan 1, 1979
8.965
+0.263
3.03%
jan 1, 1980
9.263
+0.298
3.32%
jan 1, 1981
9.477
+0.214
2.31%
jan 1, 1982
9.881
+0.404
4.27%
jan 1, 1983
9.912
+0.031
0.32%
jan 1, 1984
10.141
+0.228
2.3%
jan 1, 1985
10.665
+0.525
5.17%
jan 1, 1986
10.812
+0.147
1.38%
jan 1, 1987
10.79
-0.022
-0.21%
jan 1, 1988
10.913
+0.123
1.14%
jan 1, 1989
10.49
-0.424
-3.88%
jan 1, 1990
10.518
+0.028
0.27%
jan 1, 1991
10.539
+0.021
0.2%
jan 1, 1992
10.595
+0.056
0.53%
jan 1, 1993
10.539
-0.056
-0.53%
jan 1, 1994
10.57
+0.031
0.29%
jan 1, 1995
11.09
+0.52
4.92%
jan 1, 1996
11.829
+0.739
6.67%
jan 1, 1997
12.541
+0.712
6.02%
jan 1, 1998
13.497
+0.956
7.62%
jan 1, 1999
14.204
+0.707
5.24%
jan 1, 2000
15.395
+1.191
8.39%
jan 1, 2001
16.446
+1.051
6.83%
jan 1, 2002
17.784
+1.338
8.14%
jan 1, 2003
19.117
+1.333
7.49%
jan 1, 2004
20.625
+1.508
7.89%
jan 1, 2005
21.562
+0.937
4.54%
jan 1, 2006
22.184
+0.622
2.88%
jan 1, 2007
22.996
+0.812
3.66%
jan 1, 2008
24.025
+1.03
4.48%
jan 1, 2009
25.195
+1.169
4.87%
jan 1, 2010
26.281
+1.086
4.31%
jan 1, 2011
27.701
+1.42
5.4%
jan 1, 2012
29.877
+2.177
7.86%
jan 1, 2013
31.144
+1.267
4.24%
jan 1, 2014
32.01
+0.866
2.78%
jan 1, 2015
34.575
+2.564
8.01%
Ranking of countries by current statistics by years


Comments: