29
/
en
AIzaSyAYiBZKx7MnpbEhh9jyipgxe19OcubqV5w
April 1, 2024
36171
High income
HIC
false
2
1
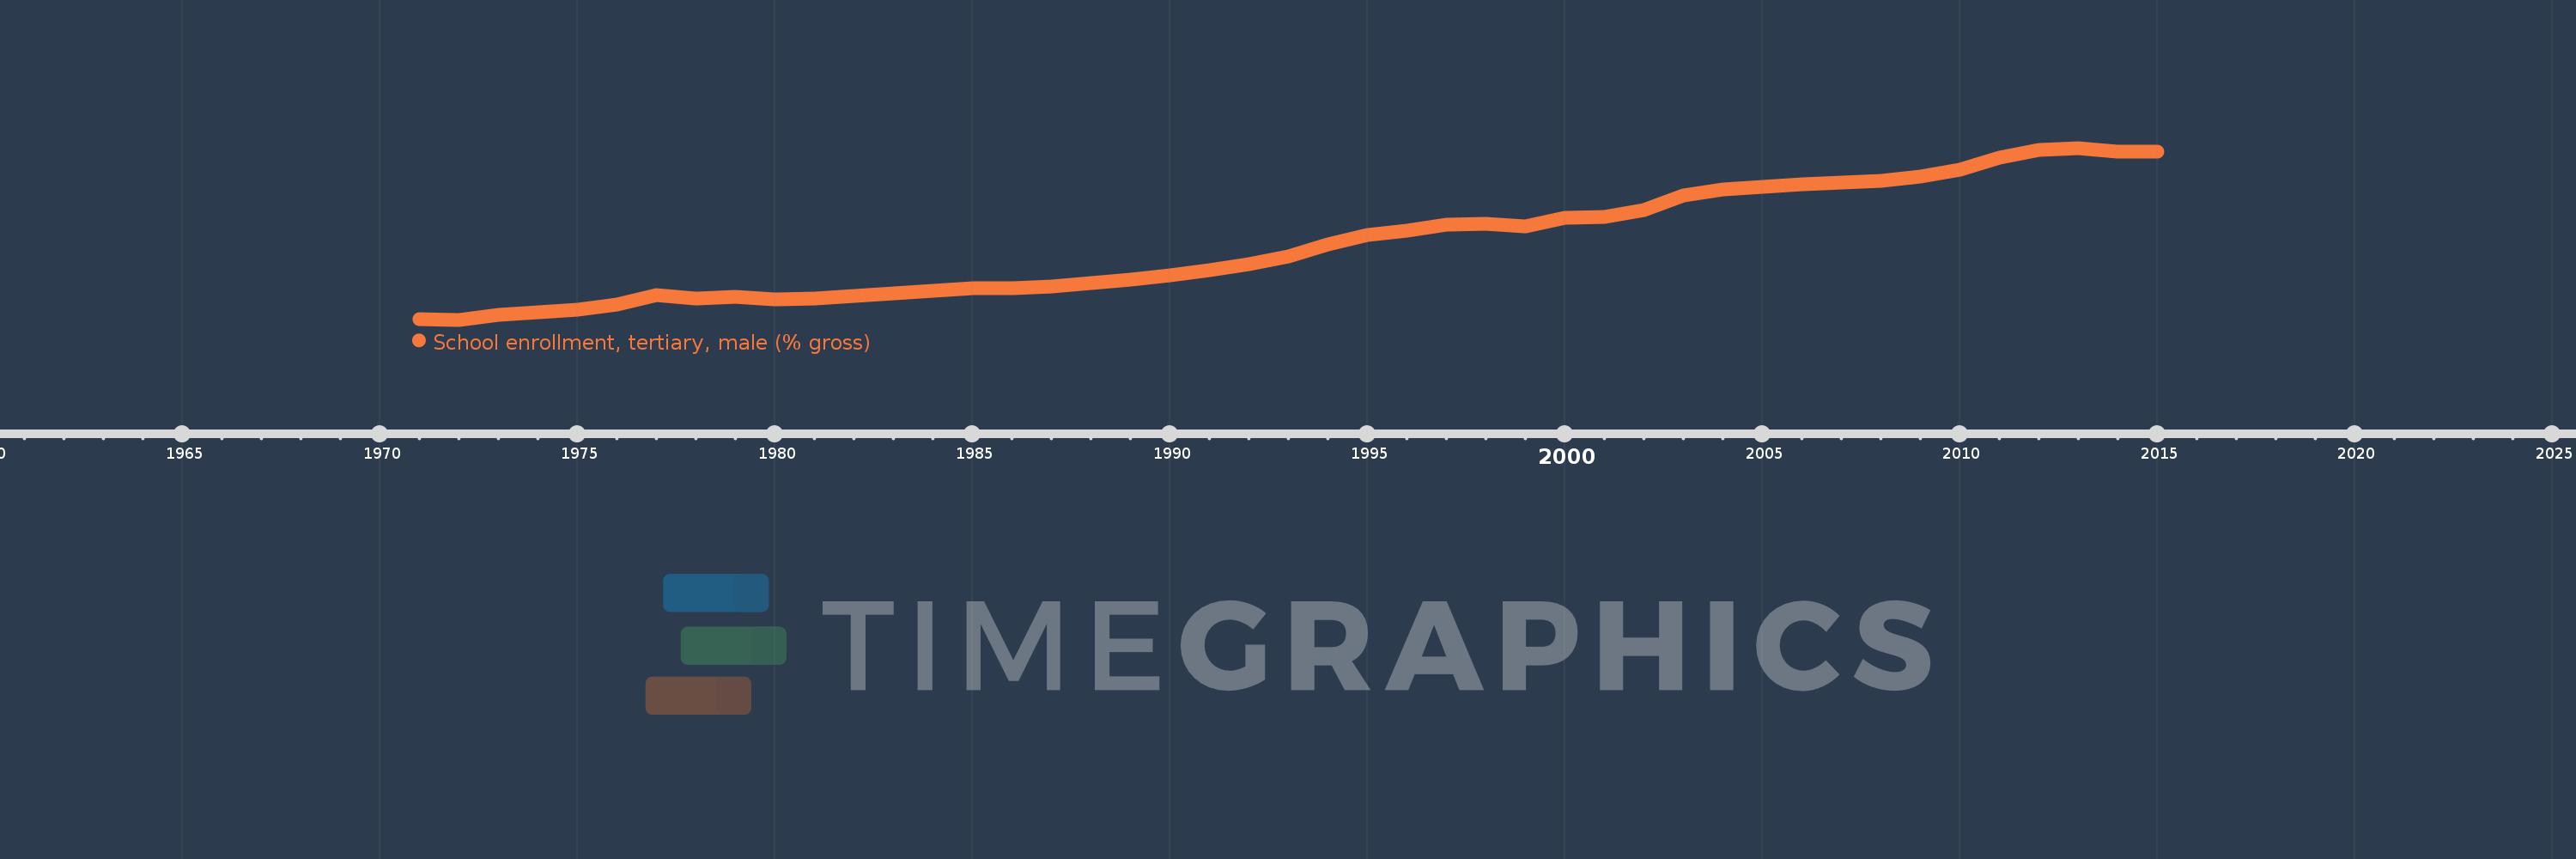
School enrollment, tertiary, male (% gross)
2015,2014,2013,2012,2011,2010,2009,2008,2007,2006,2005,2004,2003,2002,2001,2000,1999,1998,1997,1996,1995,1994,1993,1992,1991,1990,1989,1988,1987,1986,1985,1984,1983,1982,1981,1980,1979,1978,1977,1976,1975,1974,1973,1972,1971
This statistics in other country:
AfghanistanAlbaniaAlgeriaAngolaAntigua and BarbudaArab WorldArgentinaArmeniaArubaAustraliaAustriaAzerbaijanBahamas, TheBahrainBangladeshBarbadosBelarusBelgiumBelizeBeninBermudaBhutanBoliviaBosnia and HerzegovinaBotswanaBrazilBrunei DarussalamBulgariaBurkina FasoBurundiCabo VerdeCambodiaCameroonCanadaCaribbean small statesCentral African RepublicCentral Europe and the BalticsChadChileChinaColombiaComorosCongo, Dem. Rep.Congo, Rep.Costa RicaCote d'IvoireCroatiaCubaCuracaoCyprusCzech RepublicDenmarkDjiboutiDominicaDominican RepublicEarly-demographic dividendEast Asia & PacificEast Asia & Pacific (excluding high income)East Asia & Pacific (IDA & IBRD countries)EcuadorEgypt, Arab Rep.El SalvadorEquatorial GuineaEritreaEstoniaEthiopiaEuro areaEurope & Central AsiaEurope & Central Asia (excluding high income)Europe & Central Asia (IDA & IBRD countries)European UnionFijiFinlandFragile and conflict affected situationsFranceGabonGambia, TheGeorgiaGermanyGhanaGreeceGrenadaGuatemalaGuineaGuinea-BissauGuyanaHaitiHeavily indebted poor countries (HIPC)High incomeHondurasHong Kong SAR, ChinaHungaryIBRD onlyIcelandIDA & IBRD totalIDA blendIDA onlyIDA totalIndiaIndonesiaIran, Islamic Rep.IraqIrelandIsraelItalyJamaicaJapanJordanKazakhstanKenyaKorea, Dem. People’s Rep.Korea, Rep.KuwaitKyrgyz RepublicLao PDRLate-demographic dividendLatin America & Caribbean Latin America & Caribbean (excluding high income)Latin America & the Caribbean (IDA & IBRD countries)LatviaLeast developed countries: UN classificationLebanonLesothoLiberiaLibyaLiechtensteinLithuaniaLow & middle incomeLow incomeLower middle incomeLuxembourgMacao SAR, ChinaMacedonia, FYRMadagascarMalawiMaldivesMaliMaltaMarshall IslandsMauritaniaMauritiusMexicoMicronesia, Fed. Sts.Middle East & North AfricaMiddle East & North Africa (excluding high income)Middle East & North Africa (IDA & IBRD countries)Middle incomeMoldovaMongoliaMontenegroMoroccoMozambiqueMyanmarNamibiaNepalNetherlandsNew ZealandNicaraguaNigerNigeriaNorth AmericaNorwayOECD membersOmanOther small statesPacific island small statesPakistanPalauPanamaPapua New GuineaParaguayPeruPhilippinesPolandPortugalPost-demographic dividendPre-demographic dividendPuerto RicoQatarRomaniaRussian FederationRwandaSamoaSan MarinoSao Tome and PrincipeSaudi ArabiaSenegalSerbiaSeychellesSierra LeoneSingaporeSlovak RepublicSloveniaSmall statesSomaliaSouth AfricaSouth AsiaSouth Asia (IDA & IBRD)SpainSri LankaSt. Kitts and NevisSt. LuciaSt. Vincent and the GrenadinesSub-Saharan Africa Sub-Saharan Africa (excluding high income)Sub-Saharan Africa (IDA & IBRD countries)SudanSurinameSwazilandSwedenSwitzerlandSyrian Arab RepublicTajikistanTanzaniaThailandTimor-LesteTogoTongaTrinidad and TobagoTunisiaTurkeyTurkmenistanUgandaUkraineUnited Arab EmiratesUnited KingdomUnited StatesUpper middle incomeUruguayUzbekistanVanuatuVenezuela, RBVietnamWest Bank and GazaWorldYemen, Rep.ZambiaZimbabwe Timeline:
This timeline shows a graph from 1971 to 2015 of High income. No data until 1970. Number of actual observations by date: 45.
Source name:
World Development Indicators
Source organization:
United Nations Educational, Scientific, and Cultural Organization (UNESCO) Institute for Statistics.
Categories, topics:
Education, Gender
Last updated:
apr 23, 2017
Indicators value changes by year
Minimum:
30.388
jan 1, 1972
Maximum:
67.211
jan 1, 2013
At the date of observation
Value
Absolute change
Change from previous value
jan 1, 1971
30.441
+30.441
0.0%
jan 1, 1972
30.388
-0.053
-0.17%
jan 1, 1973
31.5
+1.112
3.66%
jan 1, 1974
32.019
+0.519
1.65%
jan 1, 1975
32.547
+0.527
1.65%
jan 1, 1976
33.696
+1.149
3.53%
jan 1, 1977
35.726
+2.031
6.03%
jan 1, 1978
34.939
-0.788
-2.2%
jan 1, 1979
35.297
+0.359
1.03%
jan 1, 1980
34.736
-0.561
-1.59%
jan 1, 1981
35.027
+0.291
0.84%
jan 1, 1982
35.511
+0.484
1.38%
jan 1, 1983
36.04
+0.528
1.49%
jan 1, 1984
36.612
+0.573
1.59%
jan 1, 1985
37.087
+0.475
1.3%
jan 1, 1986
37.212
+0.125
0.34%
jan 1, 1987
37.594
+0.381
1.02%
jan 1, 1988
38.283
+0.69
1.83%
jan 1, 1989
39.05
+0.767
2.0%
jan 1, 1990
39.956
+0.906
2.32%
jan 1, 1991
40.968
+1.012
2.53%
jan 1, 1992
42.267
+1.298
3.17%
jan 1, 1993
43.916
+1.649
3.9%
jan 1, 1994
46.469
+2.553
5.81%
jan 1, 1995
48.481
+2.012
4.33%
jan 1, 1996
49.552
+1.071
2.21%
jan 1, 1997
50.855
+1.303
2.63%
jan 1, 1998
51.026
+0.171
0.34%
jan 1, 1999
50.432
-0.594
-1.16%
jan 1, 2000
52.285
+1.853
3.67%
jan 1, 2001
52.395
+0.111
0.21%
jan 1, 2002
53.814
+1.419
2.71%
jan 1, 2003
57.117
+3.303
6.14%
jan 1, 2004
58.314
+1.197
2.09%
jan 1, 2005
58.789
+0.475
0.82%
jan 1, 2006
59.467
+0.678
1.15%
jan 1, 2007
59.767
+0.3
0.5%
jan 1, 2008
60.223
+0.456
0.76%
jan 1, 2009
61.076
+0.853
1.42%
jan 1, 2010
62.508
+1.432
2.34%
jan 1, 2011
65.089
+2.581
4.13%
jan 1, 2012
66.849
+1.76
2.7%
jan 1, 2013
67.211
+0.362
0.54%
jan 1, 2014
66.377
-0.834
-1.24%
jan 1, 2015
66.473
+0.096
0.14%
Ranking of countries by current statistics by years


Comments: