29
/
en
AIzaSyAYiBZKx7MnpbEhh9jyipgxe19OcubqV5w
April 1, 2024
160984
Israel
ISR
true
2
1
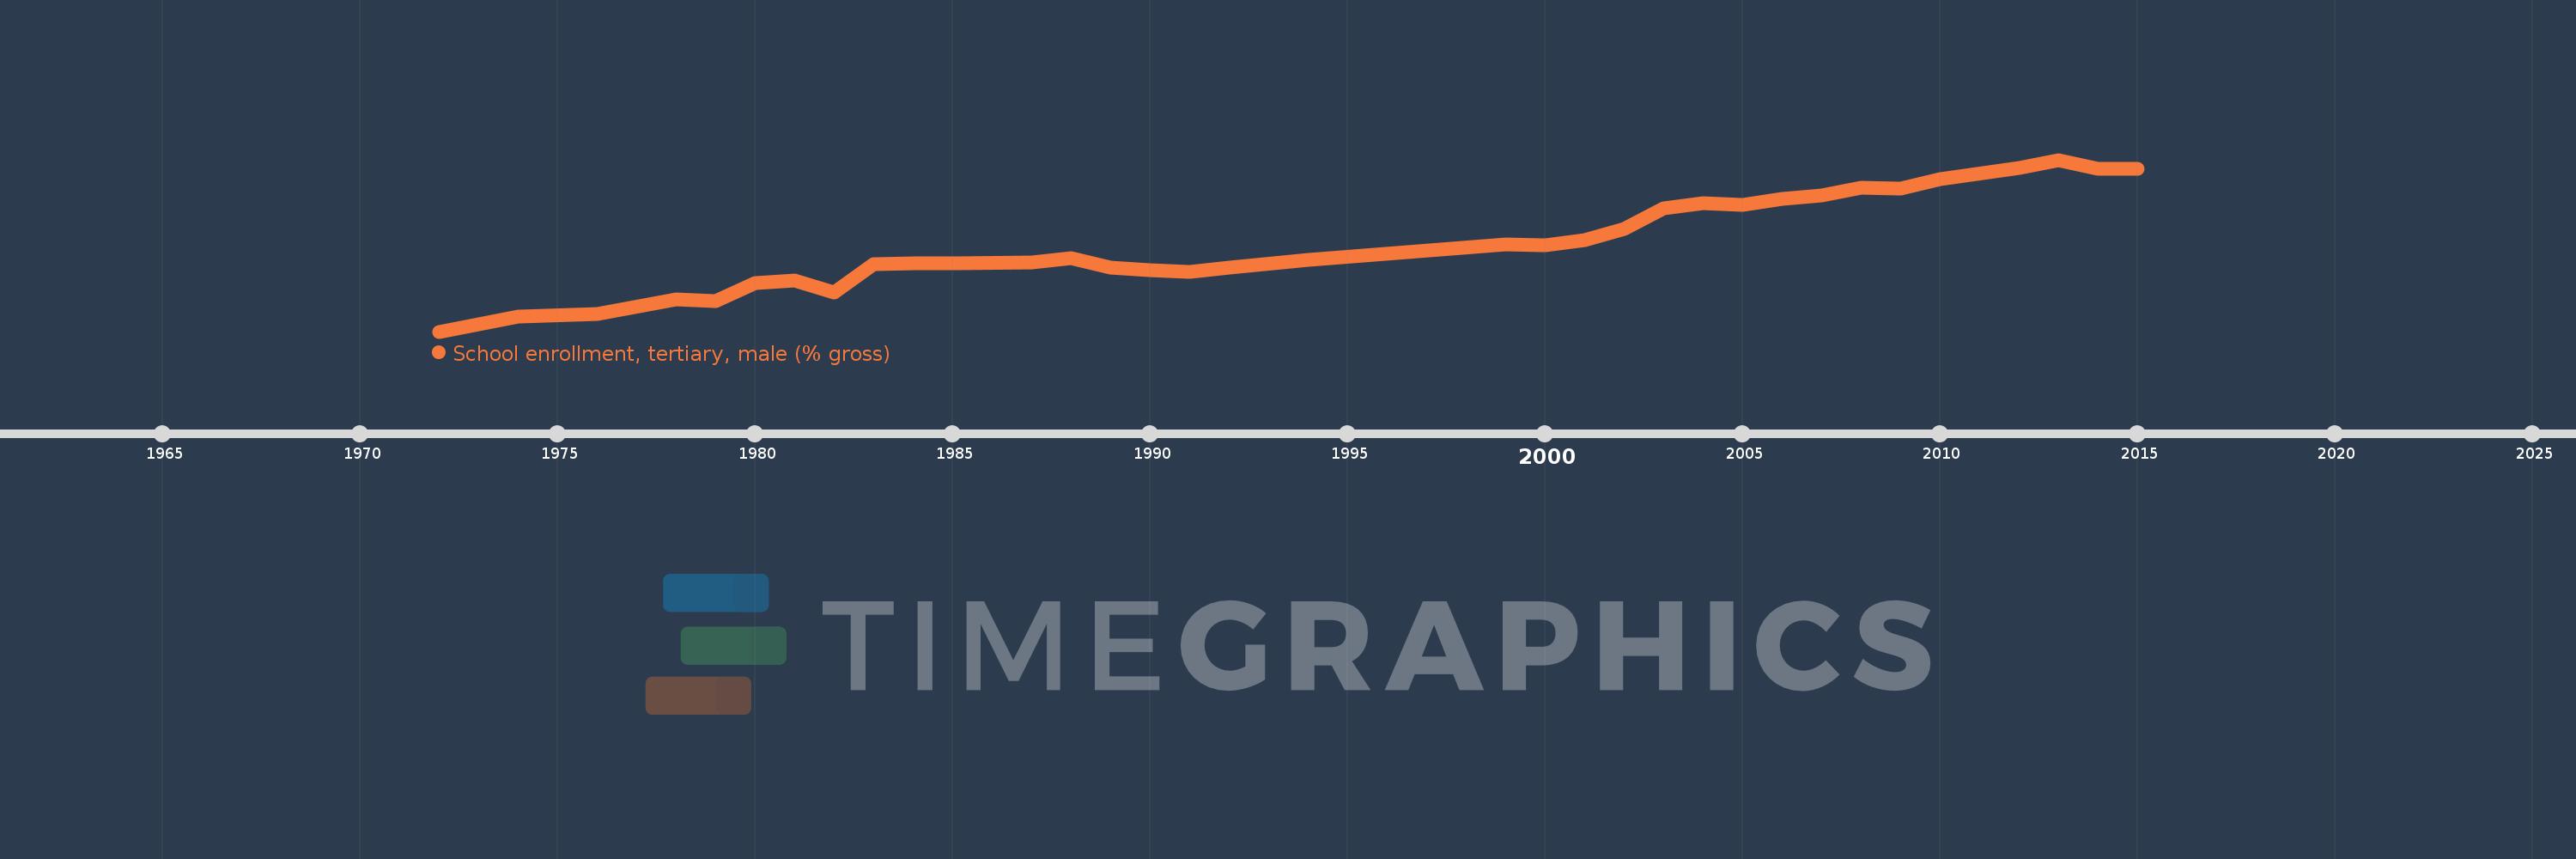
School enrollment, tertiary, male (% gross)
2015,2014,2013,2012,2010,2009,2008,2007,2006,2005,2004,2003,2002,2001,2000,1999,1994,1992,1991,1990,1989,1988,1987,1985,1984,1983,1982,1981,1980,1979,1978,1976,1974,1972
This statistics in other country:
AfghanistanAlbaniaAlgeriaAngolaAntigua and BarbudaArab WorldArgentinaArmeniaArubaAustraliaAustriaAzerbaijanBahamas, TheBahrainBangladeshBarbadosBelarusBelgiumBelizeBeninBermudaBhutanBoliviaBosnia and HerzegovinaBotswanaBrazilBrunei DarussalamBulgariaBurkina FasoBurundiCabo VerdeCambodiaCameroonCanadaCaribbean small statesCentral African RepublicCentral Europe and the BalticsChadChileChinaColombiaComorosCongo, Dem. Rep.Congo, Rep.Costa RicaCote d'IvoireCroatiaCubaCuracaoCyprusCzech RepublicDenmarkDjiboutiDominicaDominican RepublicEarly-demographic dividendEast Asia & PacificEast Asia & Pacific (excluding high income)East Asia & Pacific (IDA & IBRD countries)EcuadorEgypt, Arab Rep.El SalvadorEquatorial GuineaEritreaEstoniaEthiopiaEuro areaEurope & Central AsiaEurope & Central Asia (excluding high income)Europe & Central Asia (IDA & IBRD countries)European UnionFijiFinlandFragile and conflict affected situationsFranceGabonGambia, TheGeorgiaGermanyGhanaGreeceGrenadaGuatemalaGuineaGuinea-BissauGuyanaHaitiHeavily indebted poor countries (HIPC)High incomeHondurasHong Kong SAR, ChinaHungaryIBRD onlyIcelandIDA & IBRD totalIDA blendIDA onlyIDA totalIndiaIndonesiaIran, Islamic Rep.IraqIrelandIsraelItalyJamaicaJapanJordanKazakhstanKenyaKorea, Dem. People’s Rep.Korea, Rep.KuwaitKyrgyz RepublicLao PDRLate-demographic dividendLatin America & Caribbean Latin America & Caribbean (excluding high income)Latin America & the Caribbean (IDA & IBRD countries)LatviaLeast developed countries: UN classificationLebanonLesothoLiberiaLibyaLiechtensteinLithuaniaLow & middle incomeLow incomeLower middle incomeLuxembourgMacao SAR, ChinaMacedonia, FYRMadagascarMalawiMaldivesMaliMaltaMarshall IslandsMauritaniaMauritiusMexicoMicronesia, Fed. Sts.Middle East & North AfricaMiddle East & North Africa (excluding high income)Middle East & North Africa (IDA & IBRD countries)Middle incomeMoldovaMongoliaMontenegroMoroccoMozambiqueMyanmarNamibiaNepalNetherlandsNew ZealandNicaraguaNigerNigeriaNorth AmericaNorwayOECD membersOmanOther small statesPacific island small statesPakistanPalauPanamaPapua New GuineaParaguayPeruPhilippinesPolandPortugalPost-demographic dividendPre-demographic dividendPuerto RicoQatarRomaniaRussian FederationRwandaSamoaSan MarinoSao Tome and PrincipeSaudi ArabiaSenegalSerbiaSeychellesSierra LeoneSingaporeSlovak RepublicSloveniaSmall statesSomaliaSouth AfricaSouth AsiaSouth Asia (IDA & IBRD)SpainSri LankaSt. Kitts and NevisSt. LuciaSt. Vincent and the GrenadinesSub-Saharan Africa Sub-Saharan Africa (excluding high income)Sub-Saharan Africa (IDA & IBRD countries)SudanSurinameSwazilandSwedenSwitzerlandSyrian Arab RepublicTajikistanTanzaniaThailandTimor-LesteTogoTongaTrinidad and TobagoTunisiaTurkeyTurkmenistanUgandaUkraineUnited Arab EmiratesUnited KingdomUnited StatesUpper middle incomeUruguayUzbekistanVanuatuVenezuela, RBVietnamWest Bank and GazaWorldYemen, Rep.ZambiaZimbabwe Timeline:
This timeline shows a graph from 1972 to 2015 of Israel. No data until 1971. Number of actual observations by date: 34.
Source name:
World Development Indicators
Source organization:
United Nations Educational, Scientific, and Cultural Organization (UNESCO) Institute for Statistics.
Categories, topics:
Education, Gender
Last updated:
apr 23, 2017
Indicators value changes by year
Minimum:
20.958
jan 1, 1972
Maximum:
58.647
jan 1, 2013
At the date of observation
Value
Absolute change
Change from previous value
jan 1, 1972
20.958
+20.958
0.0%
jan 1, 1974
24.323
+3.364
16.05%
jan 1, 1976
24.822
+0.499
2.05%
jan 1, 1978
28.083
+3.261
13.14%
jan 1, 1979
27.672
-0.411
-1.46%
jan 1, 1980
31.604
+3.932
14.21%
jan 1, 1981
32.132
+0.528
1.67%
jan 1, 1982
29.572
-2.56
-7.97%
jan 1, 1983
35.713
+6.141
20.77%
jan 1, 1984
35.921
+0.209
0.58%
jan 1, 1985
35.847
-0.074
-0.21%
jan 1, 1987
36.118
+0.271
0.76%
jan 1, 1988
37.025
+0.907
2.51%
jan 1, 1989
34.96
-2.065
-5.58%
jan 1, 1990
34.37
-0.59
-1.69%
jan 1, 1991
34.005
-0.365
-1.06%
jan 1, 1992
35.028
+1.023
3.01%
jan 1, 1994
36.654
+1.626
4.64%
jan 1, 1999
40.048
+3.394
9.26%
jan 1, 2000
39.921
-0.127
-0.32%
jan 1, 2001
40.981
+1.06
2.66%
jan 1, 2002
43.447
+2.466
6.02%
jan 1, 2003
48.01
+4.562
10.5%
jan 1, 2004
49.051
+1.041
2.17%
jan 1, 2005
48.788
-0.263
-0.54%
jan 1, 2006
50.088
+1.3
2.67%
jan 1, 2007
50.891
+0.803
1.6%
jan 1, 2008
52.599
+1.708
3.36%
jan 1, 2009
52.24
-0.359
-0.68%
jan 1, 2010
54.495
+2.255
4.32%
jan 1, 2012
56.884
+2.39
4.39%
jan 1, 2013
58.647
+1.763
3.1%
jan 1, 2014
56.706
-1.941
-3.31%
jan 1, 2015
56.678
-0.028
-0.05%
Ranking of countries by current statistics by years


Comments: