29
/
en
AIzaSyAYiBZKx7MnpbEhh9jyipgxe19OcubqV5w
April 1, 2024
32180
Europe & Central Asia (excluding high income)
ECA
false
2
1
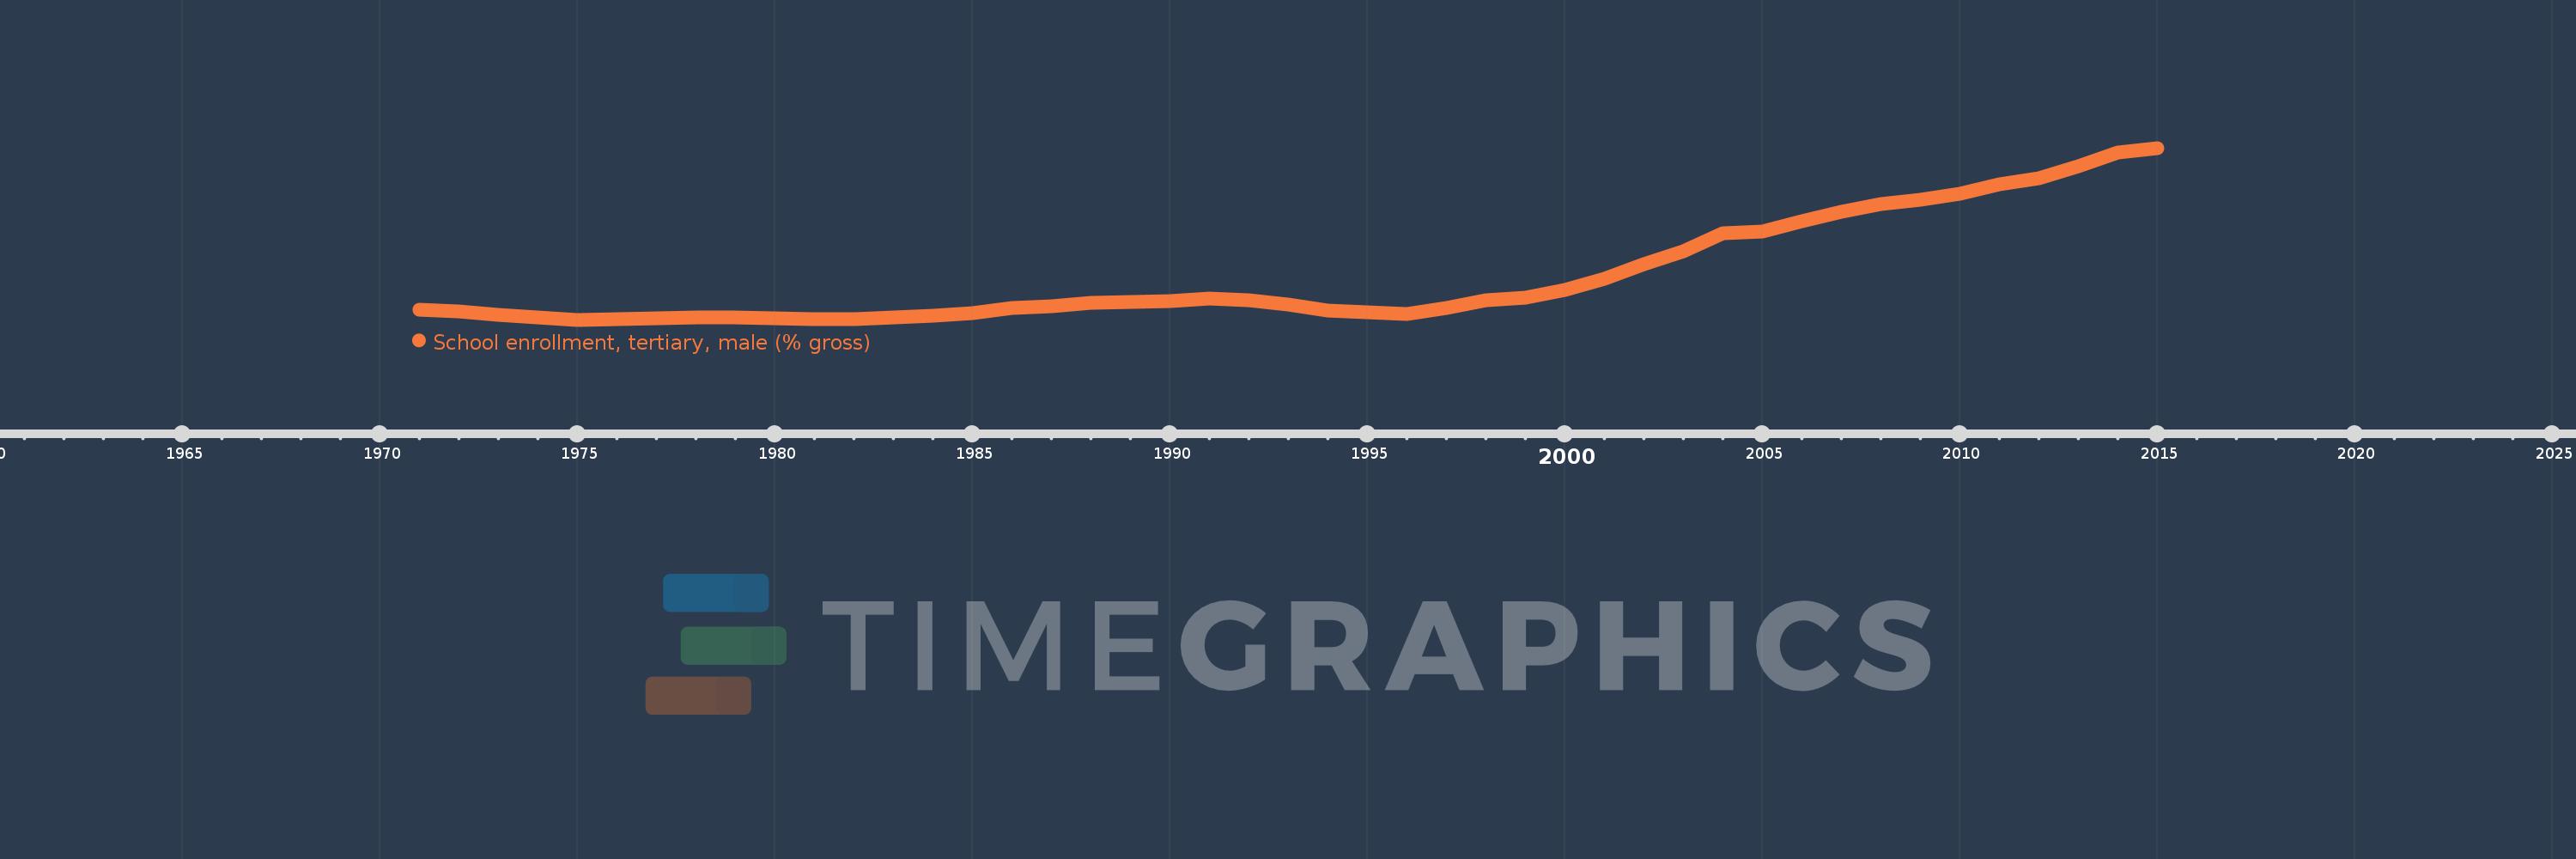
School enrollment, tertiary, male (% gross)
2015,2014,2013,2012,2011,2010,2009,2008,2007,2006,2005,2004,2003,2002,2001,2000,1999,1998,1997,1996,1995,1994,1993,1992,1991,1990,1989,1988,1987,1986,1985,1984,1983,1982,1981,1980,1979,1978,1977,1976,1975,1974,1973,1972,1971
This statistics in other country:
AfghanistanAlbaniaAlgeriaAngolaAntigua and BarbudaArab WorldArgentinaArmeniaArubaAustraliaAustriaAzerbaijanBahamas, TheBahrainBangladeshBarbadosBelarusBelgiumBelizeBeninBermudaBhutanBoliviaBosnia and HerzegovinaBotswanaBrazilBrunei DarussalamBulgariaBurkina FasoBurundiCabo VerdeCambodiaCameroonCanadaCaribbean small statesCentral African RepublicCentral Europe and the BalticsChadChileChinaColombiaComorosCongo, Dem. Rep.Congo, Rep.Costa RicaCote d'IvoireCroatiaCubaCuracaoCyprusCzech RepublicDenmarkDjiboutiDominicaDominican RepublicEarly-demographic dividendEast Asia & PacificEast Asia & Pacific (excluding high income)East Asia & Pacific (IDA & IBRD countries)EcuadorEgypt, Arab Rep.El SalvadorEquatorial GuineaEritreaEstoniaEthiopiaEuro areaEurope & Central AsiaEurope & Central Asia (excluding high income)Europe & Central Asia (IDA & IBRD countries)European UnionFijiFinlandFragile and conflict affected situationsFranceGabonGambia, TheGeorgiaGermanyGhanaGreeceGrenadaGuatemalaGuineaGuinea-BissauGuyanaHaitiHeavily indebted poor countries (HIPC)High incomeHondurasHong Kong SAR, ChinaHungaryIBRD onlyIcelandIDA & IBRD totalIDA blendIDA onlyIDA totalIndiaIndonesiaIran, Islamic Rep.IraqIrelandIsraelItalyJamaicaJapanJordanKazakhstanKenyaKorea, Dem. People’s Rep.Korea, Rep.KuwaitKyrgyz RepublicLao PDRLate-demographic dividendLatin America & Caribbean Latin America & Caribbean (excluding high income)Latin America & the Caribbean (IDA & IBRD countries)LatviaLeast developed countries: UN classificationLebanonLesothoLiberiaLibyaLiechtensteinLithuaniaLow & middle incomeLow incomeLower middle incomeLuxembourgMacao SAR, ChinaMacedonia, FYRMadagascarMalawiMaldivesMaliMaltaMarshall IslandsMauritaniaMauritiusMexicoMicronesia, Fed. Sts.Middle East & North AfricaMiddle East & North Africa (excluding high income)Middle East & North Africa (IDA & IBRD countries)Middle incomeMoldovaMongoliaMontenegroMoroccoMozambiqueMyanmarNamibiaNepalNetherlandsNew ZealandNicaraguaNigerNigeriaNorth AmericaNorwayOECD membersOmanOther small statesPacific island small statesPakistanPalauPanamaPapua New GuineaParaguayPeruPhilippinesPolandPortugalPost-demographic dividendPre-demographic dividendPuerto RicoQatarRomaniaRussian FederationRwandaSamoaSan MarinoSao Tome and PrincipeSaudi ArabiaSenegalSerbiaSeychellesSierra LeoneSingaporeSlovak RepublicSloveniaSmall statesSomaliaSouth AfricaSouth AsiaSouth Asia (IDA & IBRD)SpainSri LankaSt. Kitts and NevisSt. LuciaSt. Vincent and the GrenadinesSub-Saharan Africa Sub-Saharan Africa (excluding high income)Sub-Saharan Africa (IDA & IBRD countries)SudanSurinameSwazilandSwedenSwitzerlandSyrian Arab RepublicTajikistanTanzaniaThailandTimor-LesteTogoTongaTrinidad and TobagoTunisiaTurkeyTurkmenistanUgandaUkraineUnited Arab EmiratesUnited KingdomUnited StatesUpper middle incomeUruguayUzbekistanVanuatuVenezuela, RBVietnamWest Bank and GazaWorldYemen, Rep.ZambiaZimbabwe Timeline:
This timeline shows a graph from 1971 to 2015 of Europe & Central Asia (excluding high income). No data until 1970. Number of actual observations by date: 45.
Source name:
World Development Indicators
Source organization:
United Nations Educational, Scientific, and Cultural Organization (UNESCO) Institute for Statistics.
Categories, topics:
Education, Gender
Last updated:
apr 23, 2017
Indicators value changes by year
Minimum:
29.218
jan 1, 1975
Maximum:
59.696
jan 1, 2015
At the date of observation
Value
Absolute change
Change from previous value
jan 1, 1971
31.055
+31.055
0.0%
jan 1, 1972
30.735
-0.32
-1.03%
jan 1, 1973
30.137
-0.598
-1.94%
jan 1, 1974
29.663
-0.474
-1.57%
jan 1, 1975
29.218
-0.444
-1.5%
jan 1, 1976
29.337
+0.119
0.41%
jan 1, 1977
29.428
+0.091
0.31%
jan 1, 1978
29.593
+0.165
0.56%
jan 1, 1979
29.566
-0.027
-0.09%
jan 1, 1980
29.5
-0.066
-0.22%
jan 1, 1981
29.323
-0.177
-0.6%
jan 1, 1982
29.367
+0.044
0.15%
jan 1, 1983
29.568
+0.201
0.68%
jan 1, 1984
29.909
+0.341
1.15%
jan 1, 1985
30.41
+0.502
1.68%
jan 1, 1986
31.276
+0.865
2.85%
jan 1, 1987
31.604
+0.328
1.05%
jan 1, 1988
32.159
+0.554
1.75%
jan 1, 1989
32.397
+0.238
0.74%
jan 1, 1990
32.52
+0.123
0.38%
jan 1, 1991
32.914
+0.395
1.21%
jan 1, 1992
32.749
-0.165
-0.5%
jan 1, 1993
31.971
-0.778
-2.38%
jan 1, 1994
30.853
-1.118
-3.5%
jan 1, 1995
30.47
-0.384
-1.24%
jan 1, 1996
30.197
-0.273
-0.9%
jan 1, 1997
31.371
+1.174
3.89%
jan 1, 1998
32.711
+1.34
4.27%
jan 1, 1999
33.098
+0.387
1.18%
jan 1, 2000
34.508
+1.411
4.26%
jan 1, 2001
36.52
+2.012
5.83%
jan 1, 2002
39.152
+2.632
7.21%
jan 1, 2003
41.336
+2.184
5.58%
jan 1, 2004
44.548
+3.212
7.77%
jan 1, 2005
44.941
+0.393
0.88%
jan 1, 2006
46.674
+1.733
3.86%
jan 1, 2007
48.399
+1.726
3.7%
jan 1, 2008
49.67
+1.271
2.63%
jan 1, 2009
50.45
+0.78
1.57%
jan 1, 2010
51.644
+1.194
2.37%
jan 1, 2011
53.199
+1.555
3.01%
jan 1, 2012
54.392
+1.193
2.24%
jan 1, 2013
56.412
+2.02
3.71%
jan 1, 2014
58.955
+2.543
4.51%
jan 1, 2015
59.696
+0.741
1.26%
Ranking of countries by current statistics by years


Comments: