29
/
en
AIzaSyAYiBZKx7MnpbEhh9jyipgxe19OcubqV5w
April 1, 2024
41905
Latin America & Caribbean
LCN
false
2
1
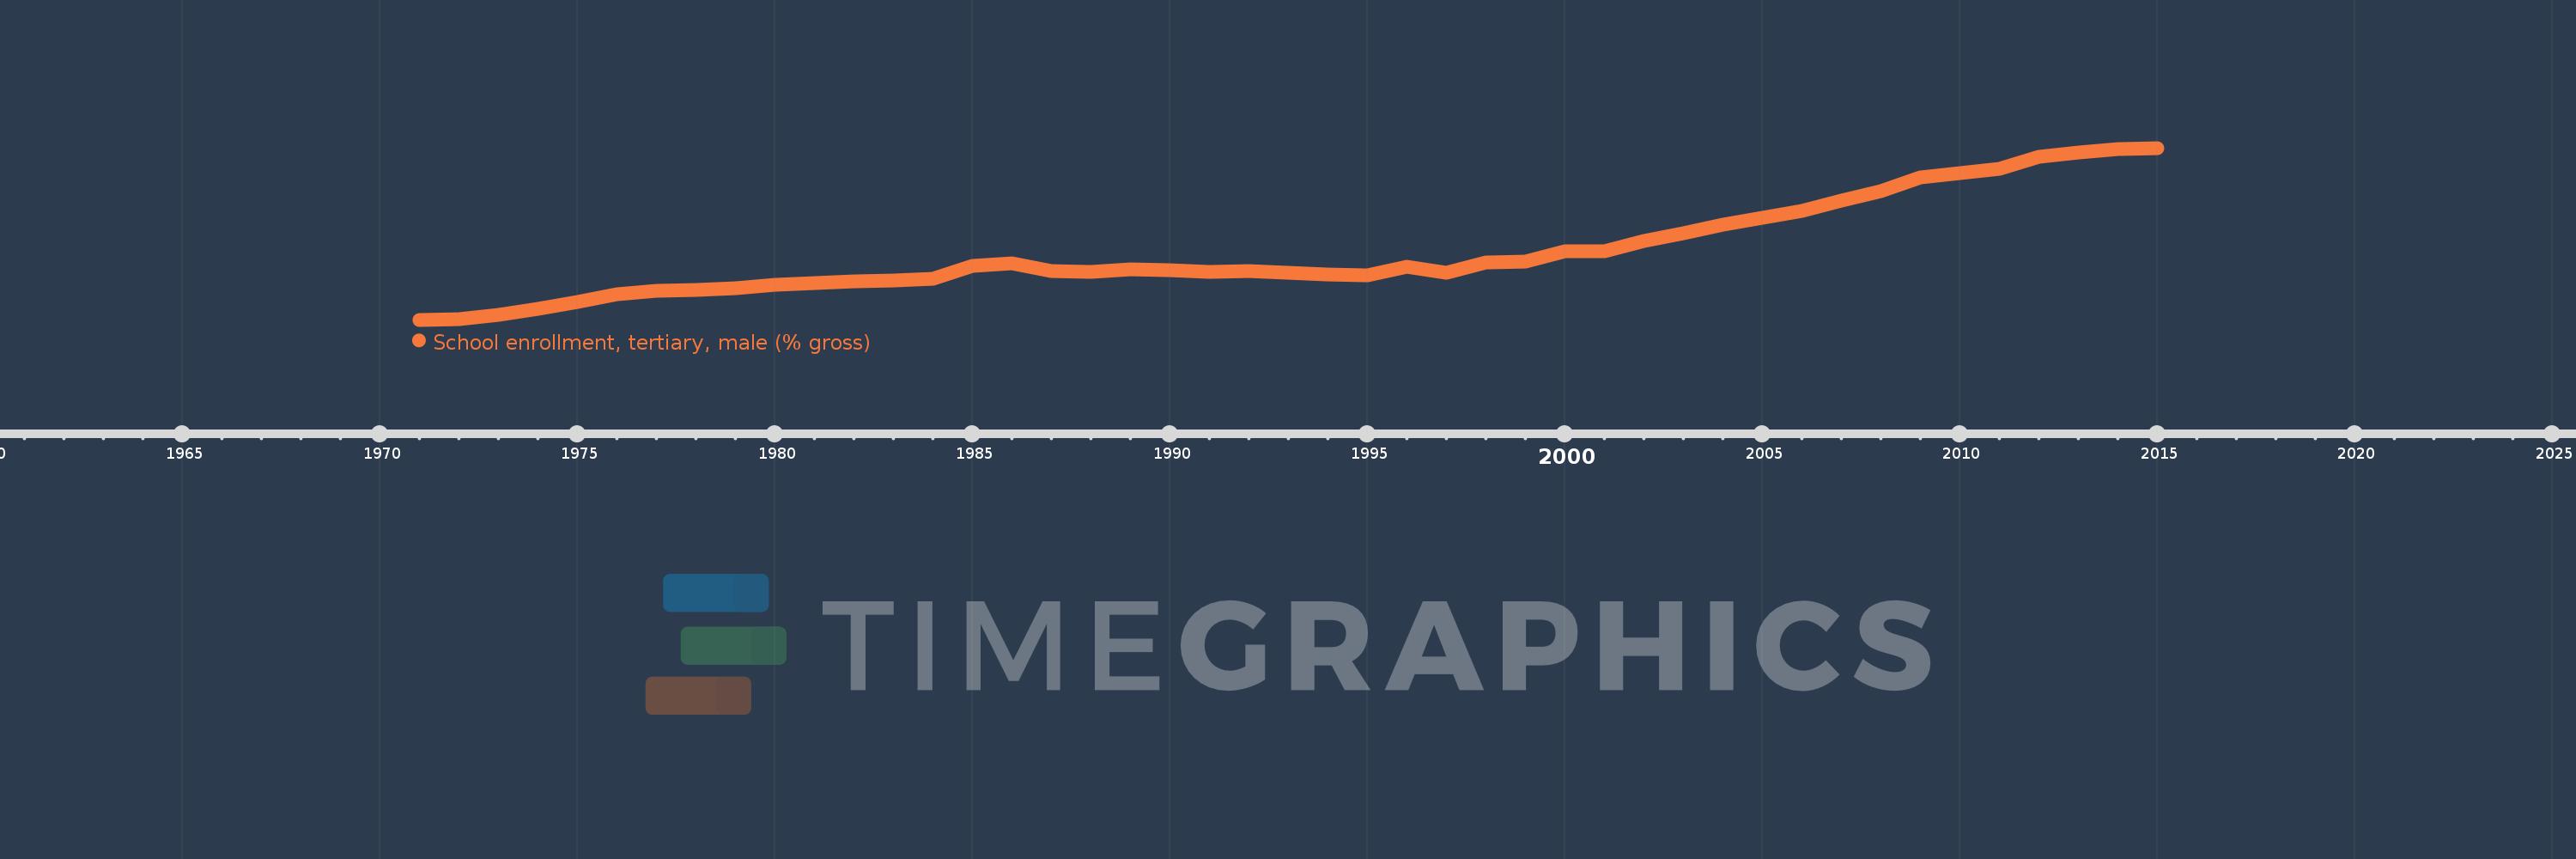
School enrollment, tertiary, male (% gross)
2015,2014,2013,2012,2011,2010,2009,2008,2007,2006,2005,2004,2003,2002,2001,2000,1999,1998,1997,1996,1995,1994,1993,1992,1991,1990,1989,1988,1987,1986,1985,1984,1983,1982,1981,1980,1979,1978,1977,1976,1975,1974,1973,1972,1971
This statistics in other country:
AfghanistanAlbaniaAlgeriaAngolaAntigua and BarbudaArab WorldArgentinaArmeniaArubaAustraliaAustriaAzerbaijanBahamas, TheBahrainBangladeshBarbadosBelarusBelgiumBelizeBeninBermudaBhutanBoliviaBosnia and HerzegovinaBotswanaBrazilBrunei DarussalamBulgariaBurkina FasoBurundiCabo VerdeCambodiaCameroonCanadaCaribbean small statesCentral African RepublicCentral Europe and the BalticsChadChileChinaColombiaComorosCongo, Dem. Rep.Congo, Rep.Costa RicaCote d'IvoireCroatiaCubaCuracaoCyprusCzech RepublicDenmarkDjiboutiDominicaDominican RepublicEarly-demographic dividendEast Asia & PacificEast Asia & Pacific (excluding high income)East Asia & Pacific (IDA & IBRD countries)EcuadorEgypt, Arab Rep.El SalvadorEquatorial GuineaEritreaEstoniaEthiopiaEuro areaEurope & Central AsiaEurope & Central Asia (excluding high income)Europe & Central Asia (IDA & IBRD countries)European UnionFijiFinlandFragile and conflict affected situationsFranceGabonGambia, TheGeorgiaGermanyGhanaGreeceGrenadaGuatemalaGuineaGuinea-BissauGuyanaHaitiHeavily indebted poor countries (HIPC)High incomeHondurasHong Kong SAR, ChinaHungaryIBRD onlyIcelandIDA & IBRD totalIDA blendIDA onlyIDA totalIndiaIndonesiaIran, Islamic Rep.IraqIrelandIsraelItalyJamaicaJapanJordanKazakhstanKenyaKorea, Dem. People’s Rep.Korea, Rep.KuwaitKyrgyz RepublicLao PDRLate-demographic dividendLatin America & Caribbean Latin America & Caribbean (excluding high income)Latin America & the Caribbean (IDA & IBRD countries)LatviaLeast developed countries: UN classificationLebanonLesothoLiberiaLibyaLiechtensteinLithuaniaLow & middle incomeLow incomeLower middle incomeLuxembourgMacao SAR, ChinaMacedonia, FYRMadagascarMalawiMaldivesMaliMaltaMarshall IslandsMauritaniaMauritiusMexicoMicronesia, Fed. Sts.Middle East & North AfricaMiddle East & North Africa (excluding high income)Middle East & North Africa (IDA & IBRD countries)Middle incomeMoldovaMongoliaMontenegroMoroccoMozambiqueMyanmarNamibiaNepalNetherlandsNew ZealandNicaraguaNigerNigeriaNorth AmericaNorwayOECD membersOmanOther small statesPacific island small statesPakistanPalauPanamaPapua New GuineaParaguayPeruPhilippinesPolandPortugalPost-demographic dividendPre-demographic dividendPuerto RicoQatarRomaniaRussian FederationRwandaSamoaSan MarinoSao Tome and PrincipeSaudi ArabiaSenegalSerbiaSeychellesSierra LeoneSingaporeSlovak RepublicSloveniaSmall statesSomaliaSouth AfricaSouth AsiaSouth Asia (IDA & IBRD)SpainSri LankaSt. Kitts and NevisSt. LuciaSt. Vincent and the GrenadinesSub-Saharan Africa Sub-Saharan Africa (excluding high income)Sub-Saharan Africa (IDA & IBRD countries)SudanSurinameSwazilandSwedenSwitzerlandSyrian Arab RepublicTajikistanTanzaniaThailandTimor-LesteTogoTongaTrinidad and TobagoTunisiaTurkeyTurkmenistanUgandaUkraineUnited Arab EmiratesUnited KingdomUnited StatesUpper middle incomeUruguayUzbekistanVanuatuVenezuela, RBVietnamWest Bank and GazaWorldYemen, Rep.ZambiaZimbabwe Timeline:
This timeline shows a graph from 1971 to 2015 of Latin America & Caribbean . No data until 1970. Number of actual observations by date: 45.
Source name:
World Development Indicators
Source organization:
United Nations Educational, Scientific, and Cultural Organization (UNESCO) Institute for Statistics.
Categories, topics:
Education, Gender
Last updated:
apr 23, 2017
Indicators value changes by year
At the date of observation
Value
Absolute change
Change from previous value
jan 1, 1971
8.562
+8.562
0.0%
jan 1, 1972
8.691
+0.129
1.5%
jan 1, 1973
9.448
+0.757
8.71%
jan 1, 1974
10.473
+1.025
10.85%
jan 1, 1975
11.729
+1.255
11.99%
jan 1, 1976
13.124
+1.395
11.89%
jan 1, 1977
13.643
+0.519
3.96%
jan 1, 1978
13.843
+0.199
1.46%
jan 1, 1979
14.185
+0.342
2.47%
jan 1, 1980
14.716
+0.531
3.75%
jan 1, 1981
15.145
+0.429
2.92%
jan 1, 1982
15.434
+0.289
1.91%
jan 1, 1983
15.49
+0.056
0.36%
jan 1, 1984
15.793
+0.304
1.96%
jan 1, 1985
18.15
+2.356
14.92%
jan 1, 1986
18.63
+0.481
2.65%
jan 1, 1987
17.221
-1.409
-7.56%
jan 1, 1988
17.106
-0.115
-0.67%
jan 1, 1989
17.547
+0.441
2.58%
jan 1, 1990
17.348
-0.199
-1.13%
jan 1, 1991
17.071
-0.278
-1.6%
jan 1, 1992
17.274
+0.203
1.19%
jan 1, 1993
16.942
-0.331
-1.92%
jan 1, 1994
16.518
-0.424
-2.5%
jan 1, 1995
16.442
-0.077
-0.46%
jan 1, 1996
17.993
+1.551
9.43%
jan 1, 1997
16.847
-1.146
-6.37%
jan 1, 1998
18.671
+1.825
10.83%
jan 1, 1999
18.83
+0.159
0.85%
jan 1, 2000
20.721
+1.891
10.04%
jan 1, 2001
20.78
+0.059
0.28%
jan 1, 2002
22.503
+1.724
8.3%
jan 1, 2003
23.934
+1.43
6.36%
jan 1, 2004
25.374
+1.44
6.02%
jan 1, 2005
26.602
+1.228
4.84%
jan 1, 2006
27.861
+1.259
4.73%
jan 1, 2007
29.696
+1.834
6.58%
jan 1, 2008
31.32
+1.625
5.47%
jan 1, 2009
33.855
+2.535
8.09%
jan 1, 2010
34.629
+0.773
2.28%
jan 1, 2011
35.378
+0.749
2.16%
jan 1, 2012
37.485
+2.107
5.95%
jan 1, 2013
38.23
+0.745
1.99%
jan 1, 2014
38.829
+0.6
1.57%
jan 1, 2015
39.04
+0.21
0.54%
Ranking of countries by current statistics by years


Comments: