29
/
en
AIzaSyAYiBZKx7MnpbEhh9jyipgxe19OcubqV5w
April 1, 2024
117399
Cyprus
CYP
true
2
1
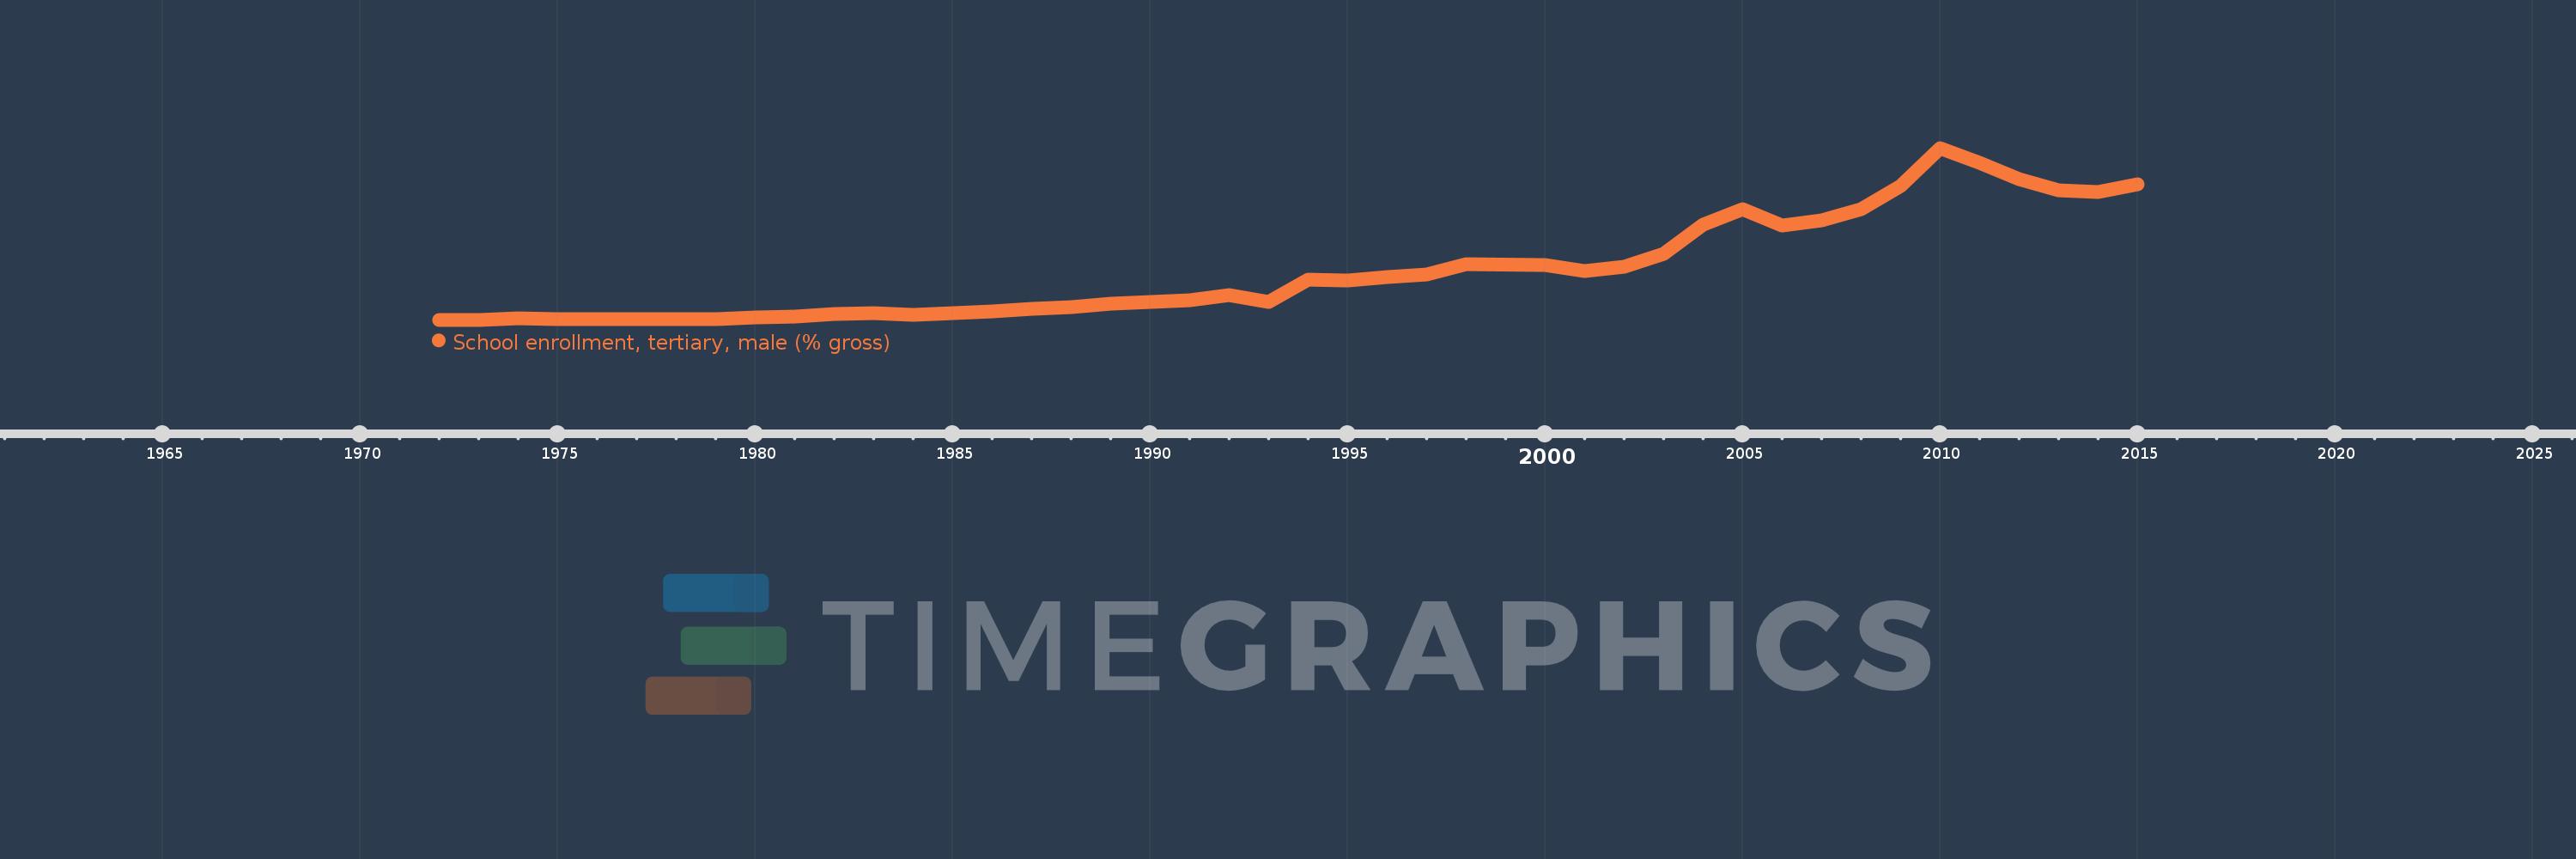
School enrollment, tertiary, male (% gross)
2015,2014,2013,2012,2011,2010,2009,2008,2007,2006,2005,2004,2003,2002,2001,2000,1998,1997,1996,1995,1994,1993,1992,1991,1990,1989,1988,1987,1986,1985,1984,1983,1982,1981,1980,1979,1975,1974,1973,1972
This statistics in other country:
AfghanistanAlbaniaAlgeriaAngolaAntigua and BarbudaArab WorldArgentinaArmeniaArubaAustraliaAustriaAzerbaijanBahamas, TheBahrainBangladeshBarbadosBelarusBelgiumBelizeBeninBermudaBhutanBoliviaBosnia and HerzegovinaBotswanaBrazilBrunei DarussalamBulgariaBurkina FasoBurundiCabo VerdeCambodiaCameroonCanadaCaribbean small statesCentral African RepublicCentral Europe and the BalticsChadChileChinaColombiaComorosCongo, Dem. Rep.Congo, Rep.Costa RicaCote d'IvoireCroatiaCubaCuracaoCyprusCzech RepublicDenmarkDjiboutiDominicaDominican RepublicEarly-demographic dividendEast Asia & PacificEast Asia & Pacific (excluding high income)East Asia & Pacific (IDA & IBRD countries)EcuadorEgypt, Arab Rep.El SalvadorEquatorial GuineaEritreaEstoniaEthiopiaEuro areaEurope & Central AsiaEurope & Central Asia (excluding high income)Europe & Central Asia (IDA & IBRD countries)European UnionFijiFinlandFragile and conflict affected situationsFranceGabonGambia, TheGeorgiaGermanyGhanaGreeceGrenadaGuatemalaGuineaGuinea-BissauGuyanaHaitiHeavily indebted poor countries (HIPC)High incomeHondurasHong Kong SAR, ChinaHungaryIBRD onlyIcelandIDA & IBRD totalIDA blendIDA onlyIDA totalIndiaIndonesiaIran, Islamic Rep.IraqIrelandIsraelItalyJamaicaJapanJordanKazakhstanKenyaKorea, Dem. People’s Rep.Korea, Rep.KuwaitKyrgyz RepublicLao PDRLate-demographic dividendLatin America & Caribbean Latin America & Caribbean (excluding high income)Latin America & the Caribbean (IDA & IBRD countries)LatviaLeast developed countries: UN classificationLebanonLesothoLiberiaLibyaLiechtensteinLithuaniaLow & middle incomeLow incomeLower middle incomeLuxembourgMacao SAR, ChinaMacedonia, FYRMadagascarMalawiMaldivesMaliMaltaMarshall IslandsMauritaniaMauritiusMexicoMicronesia, Fed. Sts.Middle East & North AfricaMiddle East & North Africa (excluding high income)Middle East & North Africa (IDA & IBRD countries)Middle incomeMoldovaMongoliaMontenegroMoroccoMozambiqueMyanmarNamibiaNepalNetherlandsNew ZealandNicaraguaNigerNigeriaNorth AmericaNorwayOECD membersOmanOther small statesPacific island small statesPakistanPalauPanamaPapua New GuineaParaguayPeruPhilippinesPolandPortugalPost-demographic dividendPre-demographic dividendPuerto RicoQatarRomaniaRussian FederationRwandaSamoaSan MarinoSao Tome and PrincipeSaudi ArabiaSenegalSerbiaSeychellesSierra LeoneSingaporeSlovak RepublicSloveniaSmall statesSomaliaSouth AfricaSouth AsiaSouth Asia (IDA & IBRD)SpainSri LankaSt. Kitts and NevisSt. LuciaSt. Vincent and the GrenadinesSub-Saharan Africa Sub-Saharan Africa (excluding high income)Sub-Saharan Africa (IDA & IBRD countries)SudanSurinameSwazilandSwedenSwitzerlandSyrian Arab RepublicTajikistanTanzaniaThailandTimor-LesteTogoTongaTrinidad and TobagoTunisiaTurkeyTurkmenistanUgandaUkraineUnited Arab EmiratesUnited KingdomUnited StatesUpper middle incomeUruguayUzbekistanVanuatuVenezuela, RBVietnamWest Bank and GazaWorldYemen, Rep.ZambiaZimbabwe Timeline:
This timeline shows a graph from 1972 to 2015 of Cyprus. No data until 1971. Number of actual observations by date: 40.
Source name:
World Development Indicators
Source organization:
United Nations Educational, Scientific, and Cultural Organization (UNESCO) Institute for Statistics.
Categories, topics:
Education, Gender
Last updated:
apr 23, 2017
Indicators value changes by year
Maximum:
55.582
jan 1, 2010
At the date of observation
Value
Absolute change
Change from previous value
jan 1, 1972
1.45
+1.45
0.0%
jan 1, 1973
1.425
-0.025
-1.69%
jan 1, 1974
1.751
+0.326
22.84%
jan 1, 1975
1.578
-0.173
-9.88%
jan 1, 1979
1.504
-0.074
-4.7%
jan 1, 1980
2.258
+0.754
50.16%
jan 1, 1981
2.361
+0.103
4.56%
jan 1, 1982
3.182
+0.821
34.79%
jan 1, 1983
3.569
+0.387
12.15%
jan 1, 1984
3.0
-0.568
-15.93%
jan 1, 1985
3.554
+0.553
18.43%
jan 1, 1986
4.16
+0.607
17.07%
jan 1, 1987
4.736
+0.575
13.83%
jan 1, 1988
5.427
+0.691
14.6%
jan 1, 1989
6.463
+1.036
19.1%
jan 1, 1990
7.101
+0.637
9.86%
jan 1, 1991
7.693
+0.592
8.34%
jan 1, 1992
9.226
+1.533
19.93%
jan 1, 1993
7.082
-2.144
-23.24%
jan 1, 1994
14.105
+7.023
99.17%
jan 1, 1995
13.93
-0.175
-1.24%
jan 1, 1996
14.953
+1.023
7.34%
jan 1, 1997
15.793
+0.841
5.62%
jan 1, 1998
18.813
+3.02
19.12%
jan 1, 2000
18.688
-0.125
-0.66%
jan 1, 2001
16.891
-1.797
-9.62%
jan 1, 2002
18.26
+1.369
8.1%
jan 1, 2003
22.274
+4.014
21.98%
jan 1, 2004
31.448
+9.174
41.19%
jan 1, 2005
36.21
+4.762
15.14%
jan 1, 2006
31.202
-5.008
-13.83%
jan 1, 2007
32.645
+1.443
4.63%
jan 1, 2008
36.287
+3.642
11.16%
jan 1, 2009
43.529
+7.242
19.96%
jan 1, 2010
55.582
+12.053
27.69%
jan 1, 2011
50.872
-4.71
-8.47%
jan 1, 2012
45.811
-5.06
-9.95%
jan 1, 2013
42.168
-3.643
-7.95%
jan 1, 2014
41.602
-0.566
-1.34%
jan 1, 2015
44.103
+2.501
6.01%
Ranking of countries by current statistics by years


Comments: