29
/
en
AIzaSyAYiBZKx7MnpbEhh9jyipgxe19OcubqV5w
April 1, 2024
74370
Austria
AUT
true
2
1
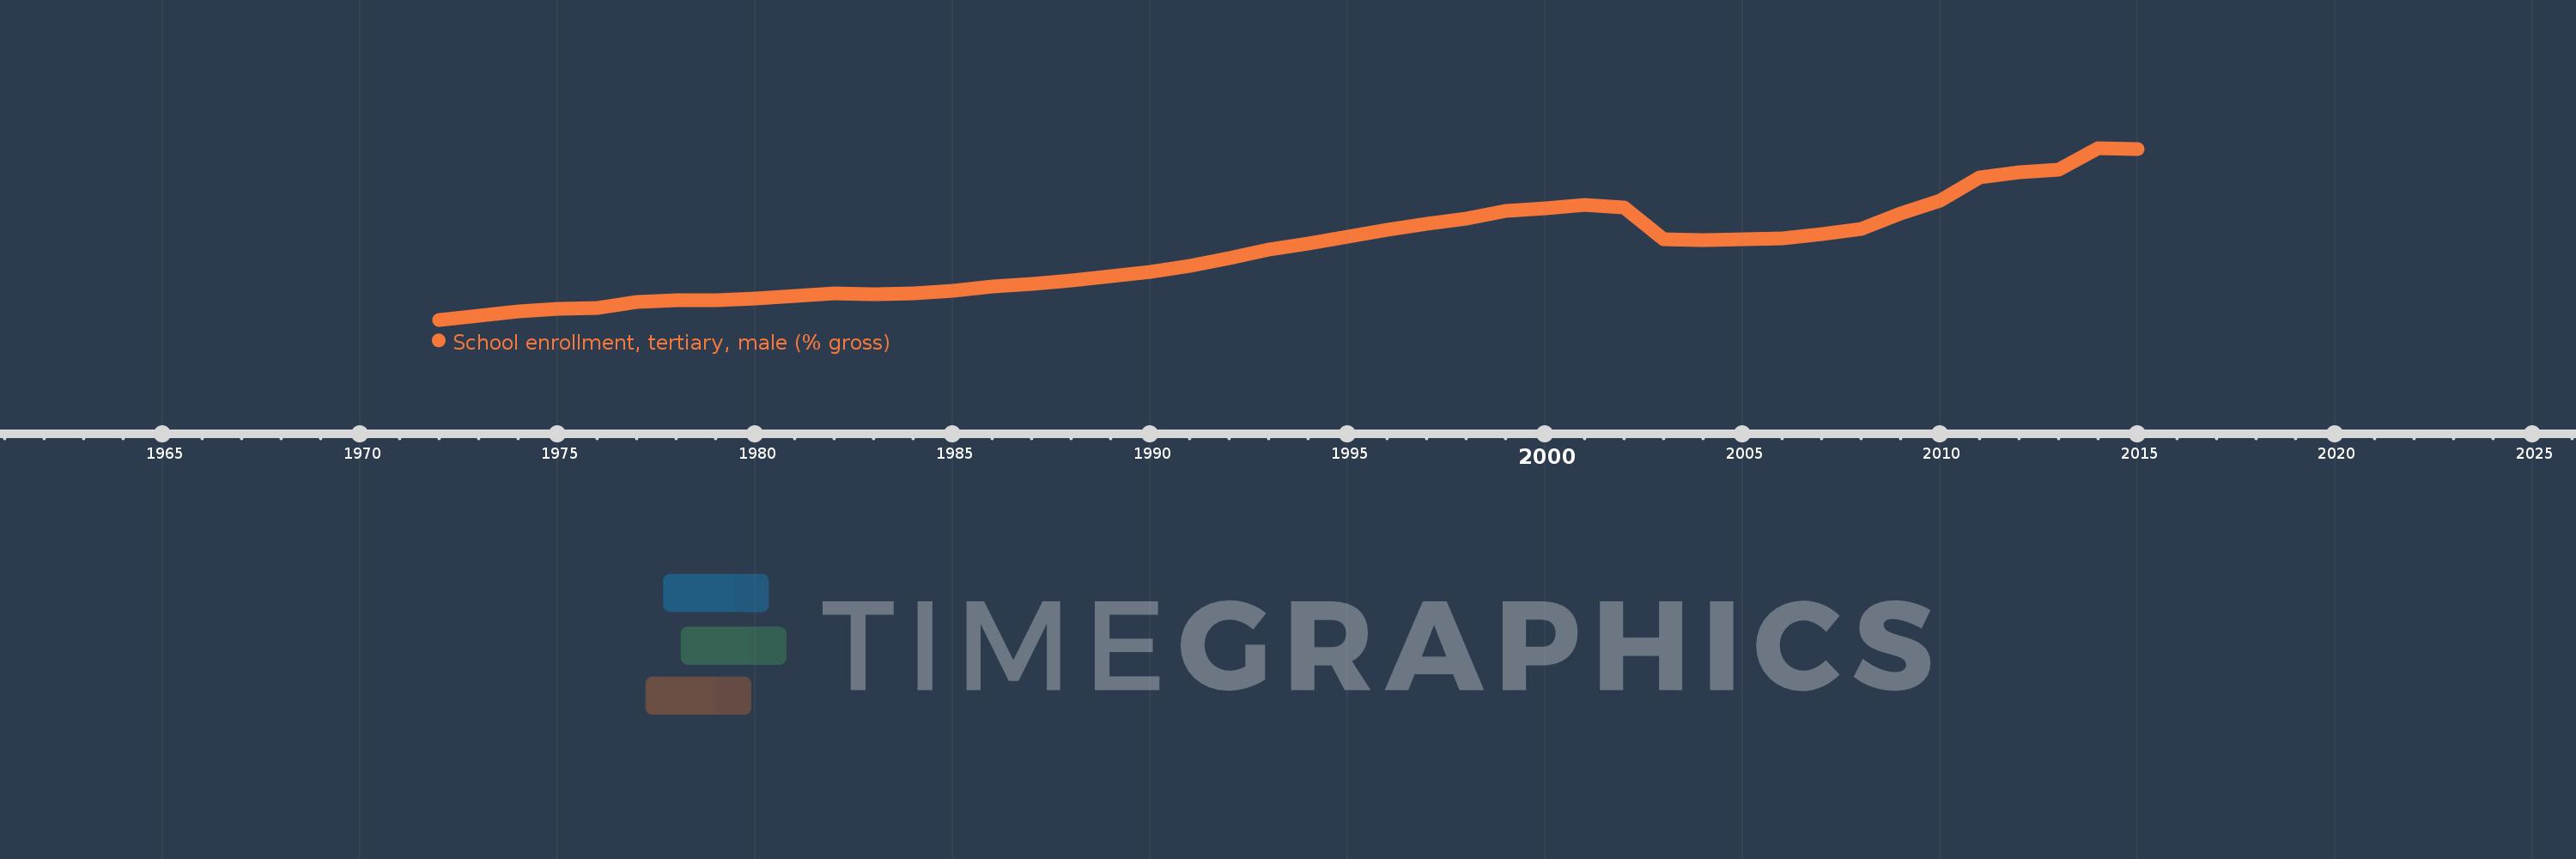
School enrollment, tertiary, male (% gross)
2015,2014,2013,2012,2011,2010,2009,2008,2007,2006,2005,2004,2003,2002,2001,2000,1999,1998,1997,1996,1995,1994,1993,1992,1991,1990,1989,1988,1987,1986,1985,1984,1983,1982,1981,1980,1979,1978,1977,1976,1975,1974,1973,1972
This statistics in other country:
AfghanistanAlbaniaAlgeriaAngolaAntigua and BarbudaArab WorldArgentinaArmeniaArubaAustraliaAustriaAzerbaijanBahamas, TheBahrainBangladeshBarbadosBelarusBelgiumBelizeBeninBermudaBhutanBoliviaBosnia and HerzegovinaBotswanaBrazilBrunei DarussalamBulgariaBurkina FasoBurundiCabo VerdeCambodiaCameroonCanadaCaribbean small statesCentral African RepublicCentral Europe and the BalticsChadChileChinaColombiaComorosCongo, Dem. Rep.Congo, Rep.Costa RicaCote d'IvoireCroatiaCubaCuracaoCyprusCzech RepublicDenmarkDjiboutiDominicaDominican RepublicEarly-demographic dividendEast Asia & PacificEast Asia & Pacific (excluding high income)East Asia & Pacific (IDA & IBRD countries)EcuadorEgypt, Arab Rep.El SalvadorEquatorial GuineaEritreaEstoniaEthiopiaEuro areaEurope & Central AsiaEurope & Central Asia (excluding high income)Europe & Central Asia (IDA & IBRD countries)European UnionFijiFinlandFragile and conflict affected situationsFranceGabonGambia, TheGeorgiaGermanyGhanaGreeceGrenadaGuatemalaGuineaGuinea-BissauGuyanaHaitiHeavily indebted poor countries (HIPC)High incomeHondurasHong Kong SAR, ChinaHungaryIBRD onlyIcelandIDA & IBRD totalIDA blendIDA onlyIDA totalIndiaIndonesiaIran, Islamic Rep.IraqIrelandIsraelItalyJamaicaJapanJordanKazakhstanKenyaKorea, Dem. People’s Rep.Korea, Rep.KuwaitKyrgyz RepublicLao PDRLate-demographic dividendLatin America & Caribbean Latin America & Caribbean (excluding high income)Latin America & the Caribbean (IDA & IBRD countries)LatviaLeast developed countries: UN classificationLebanonLesothoLiberiaLibyaLiechtensteinLithuaniaLow & middle incomeLow incomeLower middle incomeLuxembourgMacao SAR, ChinaMacedonia, FYRMadagascarMalawiMaldivesMaliMaltaMarshall IslandsMauritaniaMauritiusMexicoMicronesia, Fed. Sts.Middle East & North AfricaMiddle East & North Africa (excluding high income)Middle East & North Africa (IDA & IBRD countries)Middle incomeMoldovaMongoliaMontenegroMoroccoMozambiqueMyanmarNamibiaNepalNetherlandsNew ZealandNicaraguaNigerNigeriaNorth AmericaNorwayOECD membersOmanOther small statesPacific island small statesPakistanPalauPanamaPapua New GuineaParaguayPeruPhilippinesPolandPortugalPost-demographic dividendPre-demographic dividendPuerto RicoQatarRomaniaRussian FederationRwandaSamoaSan MarinoSao Tome and PrincipeSaudi ArabiaSenegalSerbiaSeychellesSierra LeoneSingaporeSlovak RepublicSloveniaSmall statesSomaliaSouth AfricaSouth AsiaSouth Asia (IDA & IBRD)SpainSri LankaSt. Kitts and NevisSt. LuciaSt. Vincent and the GrenadinesSub-Saharan Africa Sub-Saharan Africa (excluding high income)Sub-Saharan Africa (IDA & IBRD countries)SudanSurinameSwazilandSwedenSwitzerlandSyrian Arab RepublicTajikistanTanzaniaThailandTimor-LesteTogoTongaTrinidad and TobagoTunisiaTurkeyTurkmenistanUgandaUkraineUnited Arab EmiratesUnited KingdomUnited StatesUpper middle incomeUruguayUzbekistanVanuatuVenezuela, RBVietnamWest Bank and GazaWorldYemen, Rep.ZambiaZimbabwe Timeline:
This timeline shows a graph from 1972 to 2015 of Austria. No data until 1971. Number of actual observations by date: 44.
Source name:
World Development Indicators
Source organization:
United Nations Educational, Scientific, and Cultural Organization (UNESCO) Institute for Statistics.
Categories, topics:
Education, Gender
Last updated:
apr 23, 2017
Indicators value changes by year
Minimum:
16.964
jan 1, 1972
Maximum:
73.043
jan 1, 2014
At the date of observation
Value
Absolute change
Change from previous value
jan 1, 1972
16.964
+16.964
0.0%
jan 1, 1973
18.366
+1.402
8.27%
jan 1, 1974
19.715
+1.349
7.34%
jan 1, 1975
20.585
+0.871
4.42%
jan 1, 1976
20.9
+0.315
1.53%
jan 1, 1977
22.808
+1.907
9.13%
jan 1, 1978
23.402
+0.595
2.61%
jan 1, 1979
23.414
+0.011
0.05%
jan 1, 1980
23.893
+0.48
2.05%
jan 1, 1981
24.651
+0.757
3.17%
jan 1, 1982
25.464
+0.813
3.3%
jan 1, 1983
25.295
-0.169
-0.66%
jan 1, 1984
25.432
+0.138
0.54%
jan 1, 1985
26.29
+0.858
3.37%
jan 1, 1986
27.711
+1.421
5.4%
jan 1, 1987
28.692
+0.981
3.54%
jan 1, 1988
29.841
+1.149
4.01%
jan 1, 1989
31.315
+1.474
4.94%
jan 1, 1990
32.644
+1.329
4.24%
jan 1, 1991
34.581
+1.937
5.93%
jan 1, 1992
37.061
+2.48
7.17%
jan 1, 1993
39.864
+2.803
7.56%
jan 1, 1994
41.891
+2.027
5.09%
jan 1, 1995
44.145
+2.255
5.38%
jan 1, 1996
46.357
+2.212
5.01%
jan 1, 1997
48.395
+2.038
4.4%
jan 1, 1998
50.094
+1.699
3.51%
jan 1, 1999
52.424
+2.33
4.65%
jan 1, 2000
53.447
+1.023
1.95%
jan 1, 2001
54.38
+0.933
1.75%
jan 1, 2002
53.587
-0.793
-1.46%
jan 1, 2003
43.186
-10.401
-19.41%
jan 1, 2004
42.856
-0.33
-0.76%
jan 1, 2005
43.298
+0.441
1.03%
jan 1, 2006
43.543
+0.245
0.57%
jan 1, 2007
44.863
+1.32
3.03%
jan 1, 2008
46.662
+1.8
4.01%
jan 1, 2009
51.606
+4.944
10.6%
jan 1, 2010
55.872
+4.266
8.27%
jan 1, 2011
63.43
+7.558
13.53%
jan 1, 2012
65.162
+1.732
2.73%
jan 1, 2013
65.911
+0.749
1.15%
jan 1, 2014
73.043
+7.132
10.82%
jan 1, 2015
72.791
-0.252
-0.34%
Ranking of countries by current statistics by years


Comments: