29
/
en
AIzaSyAYiBZKx7MnpbEhh9jyipgxe19OcubqV5w
April 1, 2024
43869
Latin America & the Caribbean (IDA & IBRD countries)
TLA
false
2
1
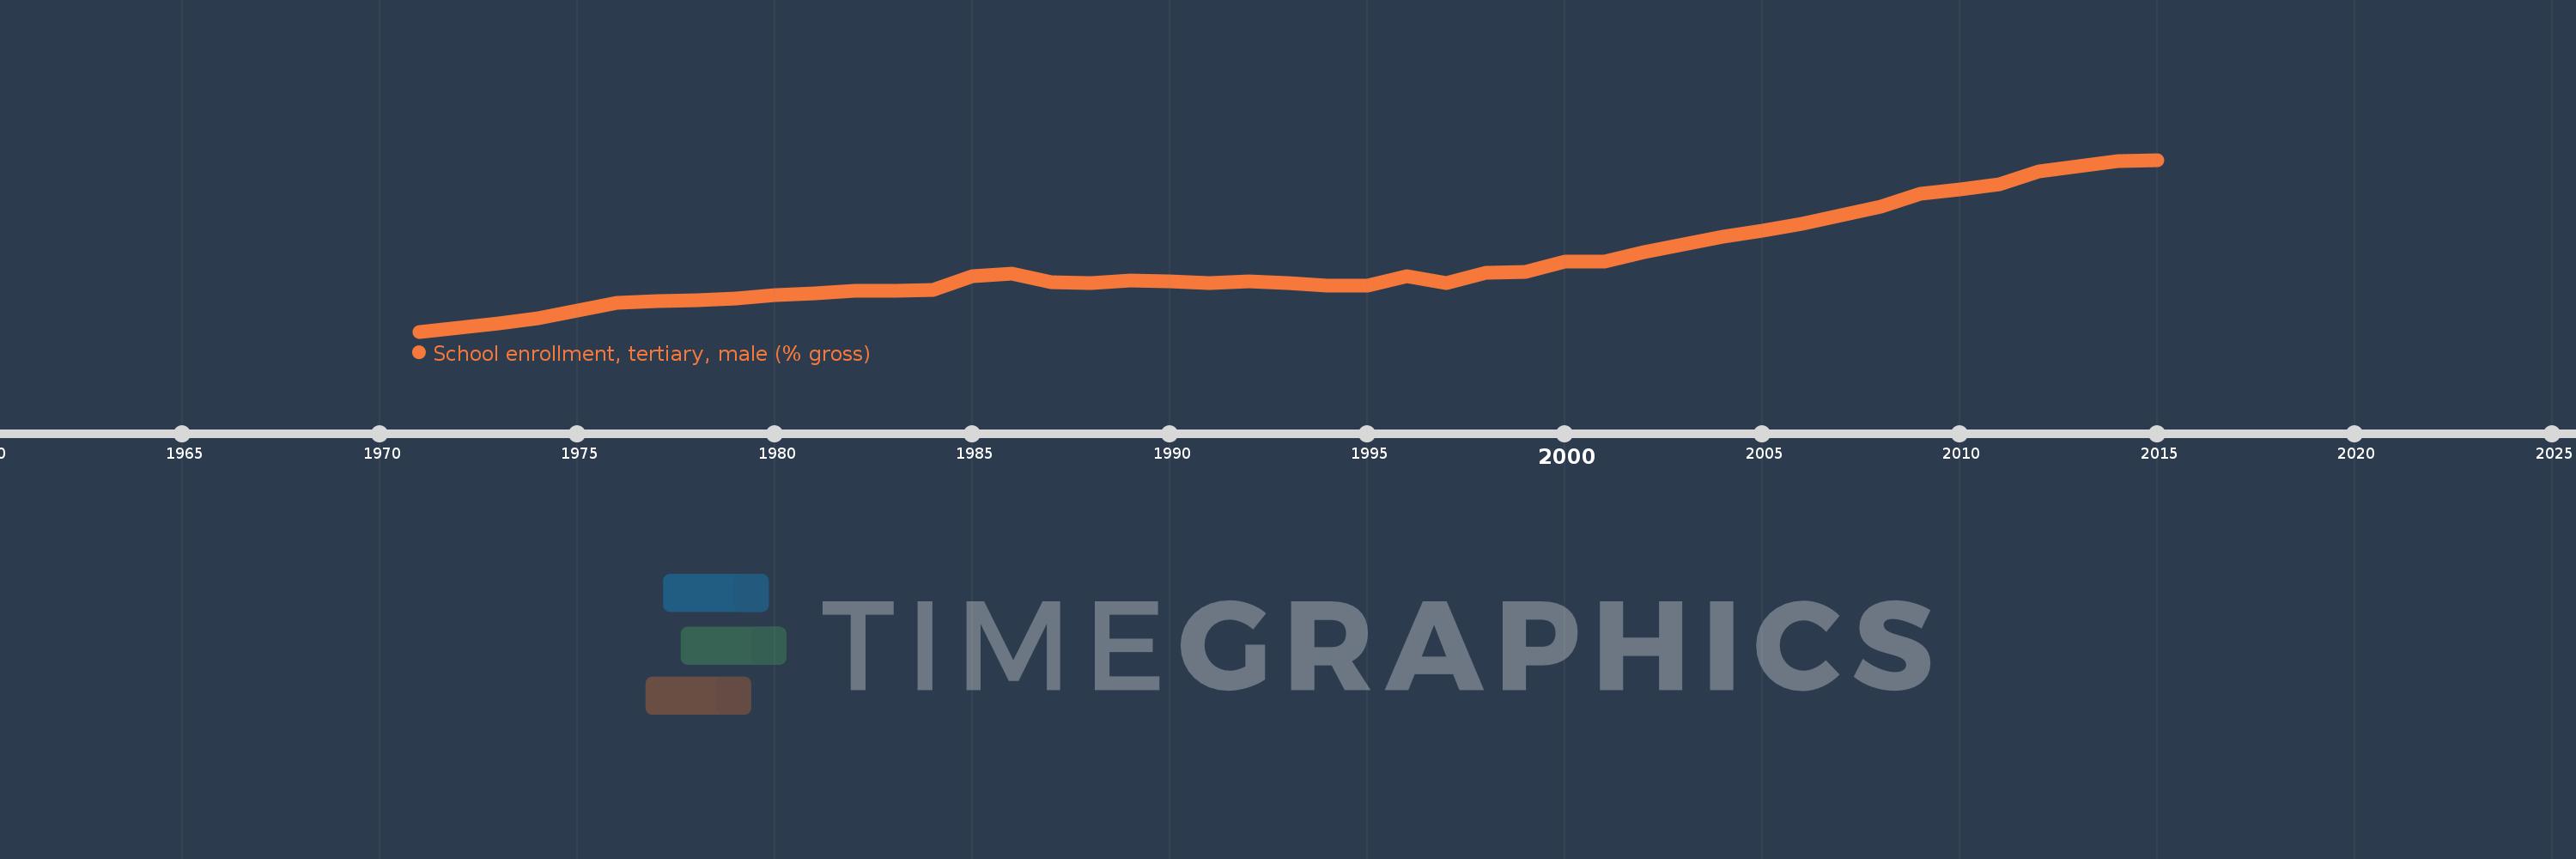
School enrollment, tertiary, male (% gross)
2015,2014,2013,2012,2011,2010,2009,2008,2007,2006,2005,2004,2003,2002,2001,2000,1999,1998,1997,1996,1995,1994,1993,1992,1991,1990,1989,1988,1987,1986,1985,1984,1983,1982,1981,1980,1979,1978,1977,1976,1975,1974,1973,1972,1971
This statistics in other country:
AfghanistanAlbaniaAlgeriaAngolaAntigua and BarbudaArab WorldArgentinaArmeniaArubaAustraliaAustriaAzerbaijanBahamas, TheBahrainBangladeshBarbadosBelarusBelgiumBelizeBeninBermudaBhutanBoliviaBosnia and HerzegovinaBotswanaBrazilBrunei DarussalamBulgariaBurkina FasoBurundiCabo VerdeCambodiaCameroonCanadaCaribbean small statesCentral African RepublicCentral Europe and the BalticsChadChileChinaColombiaComorosCongo, Dem. Rep.Congo, Rep.Costa RicaCote d'IvoireCroatiaCubaCuracaoCyprusCzech RepublicDenmarkDjiboutiDominicaDominican RepublicEarly-demographic dividendEast Asia & PacificEast Asia & Pacific (excluding high income)East Asia & Pacific (IDA & IBRD countries)EcuadorEgypt, Arab Rep.El SalvadorEquatorial GuineaEritreaEstoniaEthiopiaEuro areaEurope & Central AsiaEurope & Central Asia (excluding high income)Europe & Central Asia (IDA & IBRD countries)European UnionFijiFinlandFragile and conflict affected situationsFranceGabonGambia, TheGeorgiaGermanyGhanaGreeceGrenadaGuatemalaGuineaGuinea-BissauGuyanaHaitiHeavily indebted poor countries (HIPC)High incomeHondurasHong Kong SAR, ChinaHungaryIBRD onlyIcelandIDA & IBRD totalIDA blendIDA onlyIDA totalIndiaIndonesiaIran, Islamic Rep.IraqIrelandIsraelItalyJamaicaJapanJordanKazakhstanKenyaKorea, Dem. People’s Rep.Korea, Rep.KuwaitKyrgyz RepublicLao PDRLate-demographic dividendLatin America & Caribbean Latin America & Caribbean (excluding high income)Latin America & the Caribbean (IDA & IBRD countries)LatviaLeast developed countries: UN classificationLebanonLesothoLiberiaLibyaLiechtensteinLithuaniaLow & middle incomeLow incomeLower middle incomeLuxembourgMacao SAR, ChinaMacedonia, FYRMadagascarMalawiMaldivesMaliMaltaMarshall IslandsMauritaniaMauritiusMexicoMicronesia, Fed. Sts.Middle East & North AfricaMiddle East & North Africa (excluding high income)Middle East & North Africa (IDA & IBRD countries)Middle incomeMoldovaMongoliaMontenegroMoroccoMozambiqueMyanmarNamibiaNepalNetherlandsNew ZealandNicaraguaNigerNigeriaNorth AmericaNorwayOECD membersOmanOther small statesPacific island small statesPakistanPalauPanamaPapua New GuineaParaguayPeruPhilippinesPolandPortugalPost-demographic dividendPre-demographic dividendPuerto RicoQatarRomaniaRussian FederationRwandaSamoaSan MarinoSao Tome and PrincipeSaudi ArabiaSenegalSerbiaSeychellesSierra LeoneSingaporeSlovak RepublicSloveniaSmall statesSomaliaSouth AfricaSouth AsiaSouth Asia (IDA & IBRD)SpainSri LankaSt. Kitts and NevisSt. LuciaSt. Vincent and the GrenadinesSub-Saharan Africa Sub-Saharan Africa (excluding high income)Sub-Saharan Africa (IDA & IBRD countries)SudanSurinameSwazilandSwedenSwitzerlandSyrian Arab RepublicTajikistanTanzaniaThailandTimor-LesteTogoTongaTrinidad and TobagoTunisiaTurkeyTurkmenistanUgandaUkraineUnited Arab EmiratesUnited KingdomUnited StatesUpper middle incomeUruguayUzbekistanVanuatuVenezuela, RBVietnamWest Bank and GazaWorldYemen, Rep.ZambiaZimbabwe Timeline:
This timeline shows a graph from 1971 to 2015 of Latin America & the Caribbean (IDA & IBRD countries). No data until 1970. Number of actual observations by date: 45.
Source name:
World Development Indicators
Source organization:
United Nations Educational, Scientific, and Cultural Organization (UNESCO) Institute for Statistics.
Categories, topics:
Education, Gender
Last updated:
apr 23, 2017
Indicators value changes by year
Maximum:
39.004
jan 1, 2015
At the date of observation
Value
Absolute change
Change from previous value
jan 1, 1971
7.926
+7.926
0.0%
jan 1, 1972
8.682
+0.756
9.53%
jan 1, 1973
9.4
+0.718
8.28%
jan 1, 1974
10.405
+1.005
10.69%
jan 1, 1975
11.663
+1.258
12.09%
jan 1, 1976
13.056
+1.393
11.94%
jan 1, 1977
13.518
+0.462
3.54%
jan 1, 1978
13.643
+0.125
0.93%
jan 1, 1979
13.912
+0.269
1.97%
jan 1, 1980
14.468
+0.556
3.99%
jan 1, 1981
14.904
+0.436
3.02%
jan 1, 1982
15.249
+0.345
2.32%
jan 1, 1983
15.336
+0.086
0.57%
jan 1, 1984
15.483
+0.147
0.96%
jan 1, 1985
17.914
+2.431
15.7%
jan 1, 1986
18.395
+0.481
2.68%
jan 1, 1987
16.885
-1.51
-8.21%
jan 1, 1988
16.732
-0.153
-0.91%
jan 1, 1989
17.184
+0.452
2.7%
jan 1, 1990
17.024
-0.159
-0.93%
jan 1, 1991
16.763
-0.261
-1.53%
jan 1, 1992
16.972
+0.209
1.25%
jan 1, 1993
16.675
-0.297
-1.75%
jan 1, 1994
16.283
-0.393
-2.35%
jan 1, 1995
16.23
-0.053
-0.33%
jan 1, 1996
17.888
+1.659
10.22%
jan 1, 1997
16.722
-1.166
-6.52%
jan 1, 1998
18.589
+1.867
11.16%
jan 1, 1999
18.738
+0.149
0.8%
jan 1, 2000
20.522
+1.784
9.52%
jan 1, 2001
20.573
+0.051
0.25%
jan 1, 2002
22.283
+1.711
8.31%
jan 1, 2003
23.742
+1.459
6.55%
jan 1, 2004
25.158
+1.416
5.96%
jan 1, 2005
26.244
+1.086
4.32%
jan 1, 2006
27.434
+1.19
4.53%
jan 1, 2007
28.982
+1.548
5.64%
jan 1, 2008
30.483
+1.501
5.18%
jan 1, 2009
32.807
+2.323
7.62%
jan 1, 2010
33.61
+0.803
2.45%
jan 1, 2011
34.604
+0.994
2.96%
jan 1, 2012
36.926
+2.322
6.71%
jan 1, 2013
37.88
+0.954
2.58%
jan 1, 2014
38.713
+0.833
2.2%
jan 1, 2015
39.004
+0.291
0.75%
Ranking of countries by current statistics by years


Comments: