29
/
en
AIzaSyAYiBZKx7MnpbEhh9jyipgxe19OcubqV5w
April 1, 2024
272949
Uganda
UGA
true
2
1
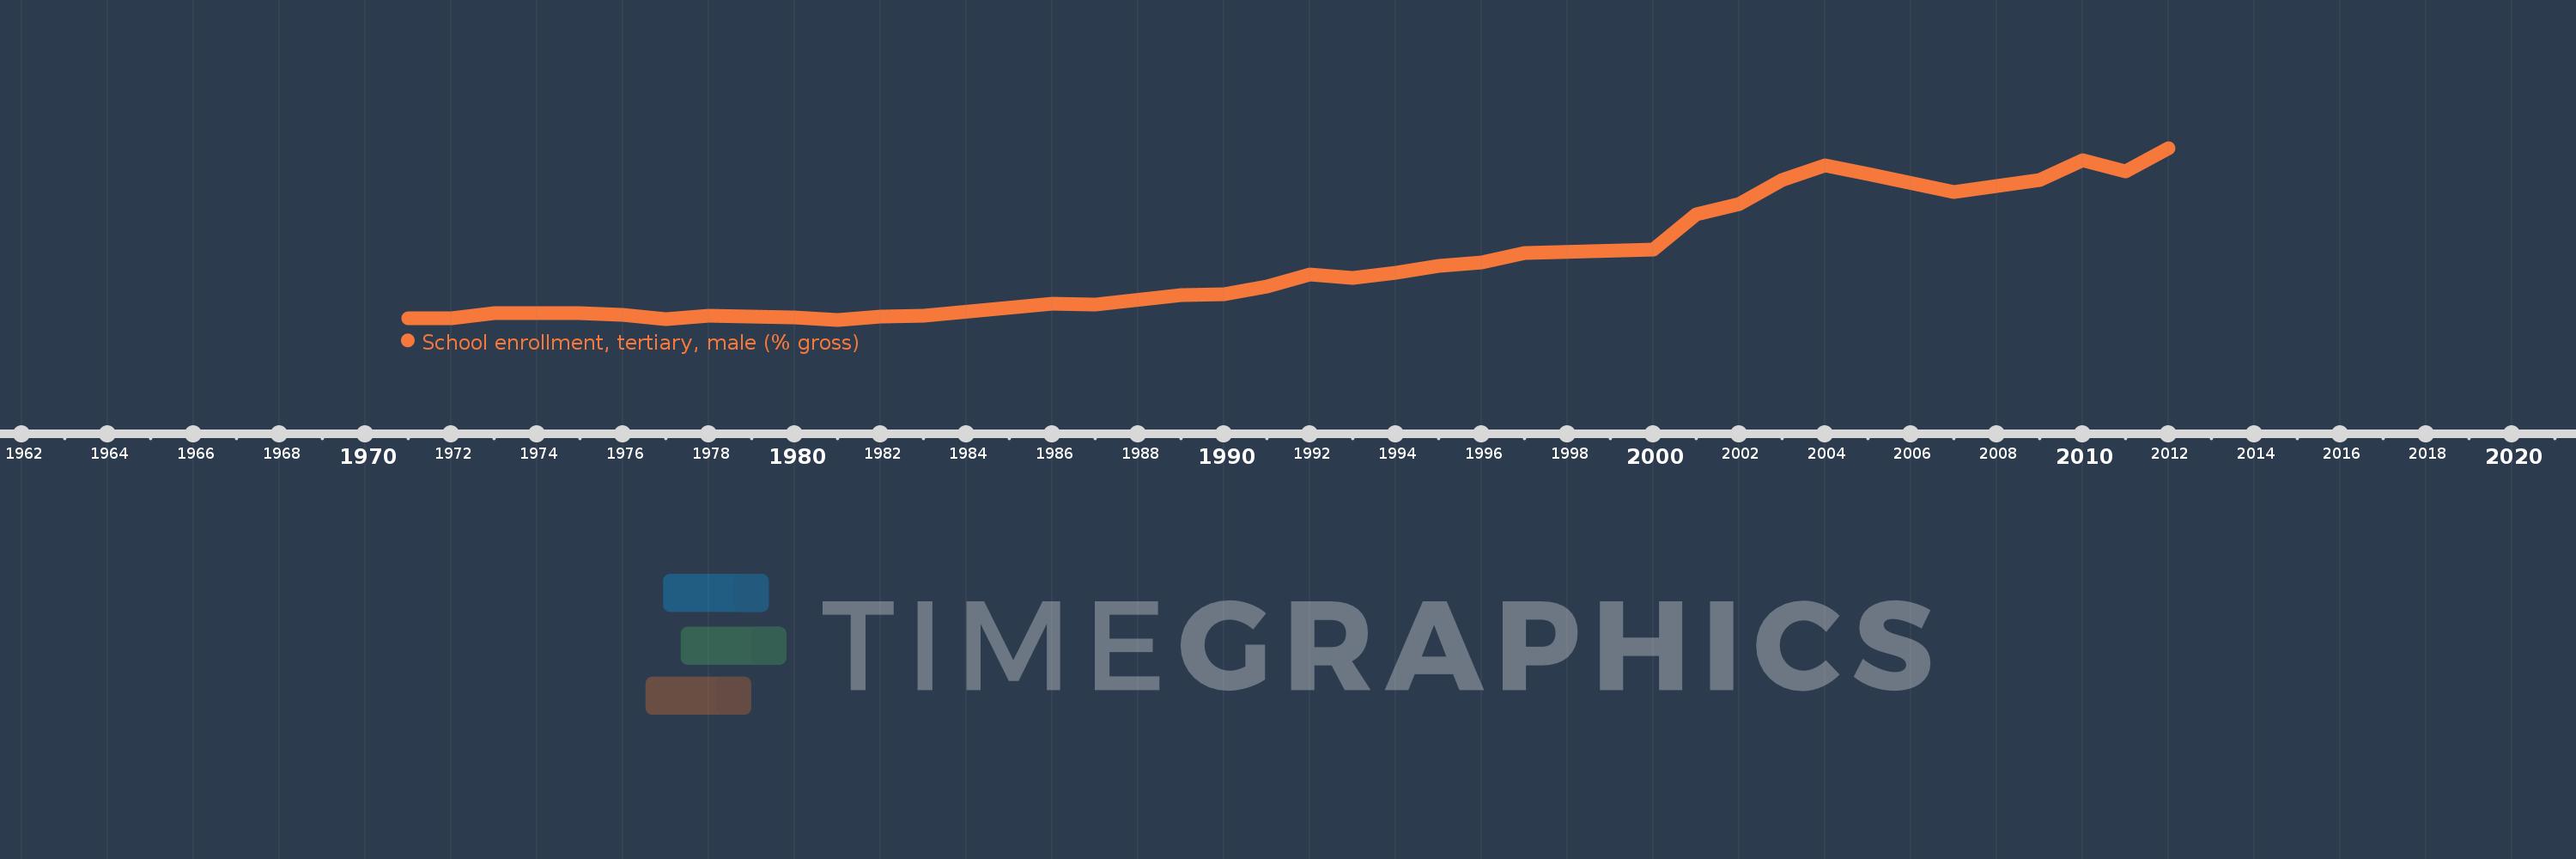
School enrollment, tertiary, male (% gross)
2012,2011,2010,2009,2007,2005,2004,2003,2002,2001,2000,1997,1996,1995,1994,1993,1992,1991,1990,1989,1987,1986,1983,1982,1981,1980,1978,1977,1976,1975,1973,1972,1971
This statistics in other country:
AfghanistanAlbaniaAlgeriaAngolaAntigua and BarbudaArab WorldArgentinaArmeniaArubaAustraliaAustriaAzerbaijanBahamas, TheBahrainBangladeshBarbadosBelarusBelgiumBelizeBeninBermudaBhutanBoliviaBosnia and HerzegovinaBotswanaBrazilBrunei DarussalamBulgariaBurkina FasoBurundiCabo VerdeCambodiaCameroonCanadaCaribbean small statesCentral African RepublicCentral Europe and the BalticsChadChileChinaColombiaComorosCongo, Dem. Rep.Congo, Rep.Costa RicaCote d'IvoireCroatiaCubaCuracaoCyprusCzech RepublicDenmarkDjiboutiDominicaDominican RepublicEarly-demographic dividendEast Asia & PacificEast Asia & Pacific (excluding high income)East Asia & Pacific (IDA & IBRD countries)EcuadorEgypt, Arab Rep.El SalvadorEquatorial GuineaEritreaEstoniaEthiopiaEuro areaEurope & Central AsiaEurope & Central Asia (excluding high income)Europe & Central Asia (IDA & IBRD countries)European UnionFijiFinlandFragile and conflict affected situationsFranceGabonGambia, TheGeorgiaGermanyGhanaGreeceGrenadaGuatemalaGuineaGuinea-BissauGuyanaHaitiHeavily indebted poor countries (HIPC)High incomeHondurasHong Kong SAR, ChinaHungaryIBRD onlyIcelandIDA & IBRD totalIDA blendIDA onlyIDA totalIndiaIndonesiaIran, Islamic Rep.IraqIrelandIsraelItalyJamaicaJapanJordanKazakhstanKenyaKorea, Dem. People’s Rep.Korea, Rep.KuwaitKyrgyz RepublicLao PDRLate-demographic dividendLatin America & Caribbean Latin America & Caribbean (excluding high income)Latin America & the Caribbean (IDA & IBRD countries)LatviaLeast developed countries: UN classificationLebanonLesothoLiberiaLibyaLiechtensteinLithuaniaLow & middle incomeLow incomeLower middle incomeLuxembourgMacao SAR, ChinaMacedonia, FYRMadagascarMalawiMaldivesMaliMaltaMarshall IslandsMauritaniaMauritiusMexicoMicronesia, Fed. Sts.Middle East & North AfricaMiddle East & North Africa (excluding high income)Middle East & North Africa (IDA & IBRD countries)Middle incomeMoldovaMongoliaMontenegroMoroccoMozambiqueMyanmarNamibiaNepalNetherlandsNew ZealandNicaraguaNigerNigeriaNorth AmericaNorwayOECD membersOmanOther small statesPacific island small statesPakistanPalauPanamaPapua New GuineaParaguayPeruPhilippinesPolandPortugalPost-demographic dividendPre-demographic dividendPuerto RicoQatarRomaniaRussian FederationRwandaSamoaSan MarinoSao Tome and PrincipeSaudi ArabiaSenegalSerbiaSeychellesSierra LeoneSingaporeSlovak RepublicSloveniaSmall statesSomaliaSouth AfricaSouth AsiaSouth Asia (IDA & IBRD)SpainSri LankaSt. Kitts and NevisSt. LuciaSt. Vincent and the GrenadinesSub-Saharan Africa Sub-Saharan Africa (excluding high income)Sub-Saharan Africa (IDA & IBRD countries)SudanSurinameSwazilandSwedenSwitzerlandSyrian Arab RepublicTajikistanTanzaniaThailandTimor-LesteTogoTongaTrinidad and TobagoTunisiaTurkeyTurkmenistanUgandaUkraineUnited Arab EmiratesUnited KingdomUnited StatesUpper middle incomeUruguayUzbekistanVanuatuVenezuela, RBVietnamWest Bank and GazaWorldYemen, Rep.ZambiaZimbabwe Timeline:
This timeline shows a graph from 1971 to 2012 of Uganda. No data until 1970. Number of actual observations by date: 33.
Source name:
World Development Indicators
Source organization:
United Nations Educational, Scientific, and Cultural Organization (UNESCO) Institute for Statistics.
Categories, topics:
Education, Gender
Last updated:
apr 23, 2017
Indicators value changes by year
At the date of observation
Value
Absolute change
Change from previous value
jan 1, 1971
0.882
+0.882
0.0%
jan 1, 1972
0.867
-0.015
-1.72%
jan 1, 1973
0.993
+0.126
14.55%
jan 1, 1975
1.001
+0.008
0.78%
jan 1, 1976
0.955
-0.045
-4.5%
jan 1, 1977
0.854
-0.102
-10.66%
jan 1, 1978
0.947
+0.094
10.97%
jan 1, 1980
0.893
-0.055
-5.77%
jan 1, 1981
0.839
-0.053
-5.98%
jan 1, 1982
0.908
+0.069
8.21%
jan 1, 1983
0.932
+0.024
2.63%
jan 1, 1986
1.225
+0.292
31.38%
jan 1, 1987
1.208
-0.017
-1.35%
jan 1, 1989
1.439
+0.231
19.12%
jan 1, 1990
1.459
+0.02
1.39%
jan 1, 1991
1.65
+0.191
13.06%
jan 1, 1992
1.941
+0.292
17.69%
jan 1, 1993
1.872
-0.069
-3.57%
jan 1, 1994
1.997
+0.125
6.65%
jan 1, 1995
2.152
+0.156
7.81%
jan 1, 1996
2.248
+0.096
4.45%
jan 1, 1997
2.469
+0.221
9.81%
jan 1, 2000
2.558
+0.089
3.6%
jan 1, 2001
3.425
+0.867
33.9%
jan 1, 2002
3.672
+0.247
7.21%
jan 1, 2003
4.267
+0.595
16.2%
jan 1, 2004
4.62
+0.353
8.28%
jan 1, 2005
4.405
-0.215
-4.65%
jan 1, 2007
3.964
-0.441
-10.01%
jan 1, 2009
4.254
+0.29
7.32%
jan 1, 2010
4.732
+0.478
11.23%
jan 1, 2011
4.474
-0.259
-5.46%
jan 1, 2012
5.04
+0.567
12.66%
Ranking of countries by current statistics by years


Comments: