29
/
en
AIzaSyAYiBZKx7MnpbEhh9jyipgxe19OcubqV5w
April 1, 2024
105442
Chile
CHL
true
2
1
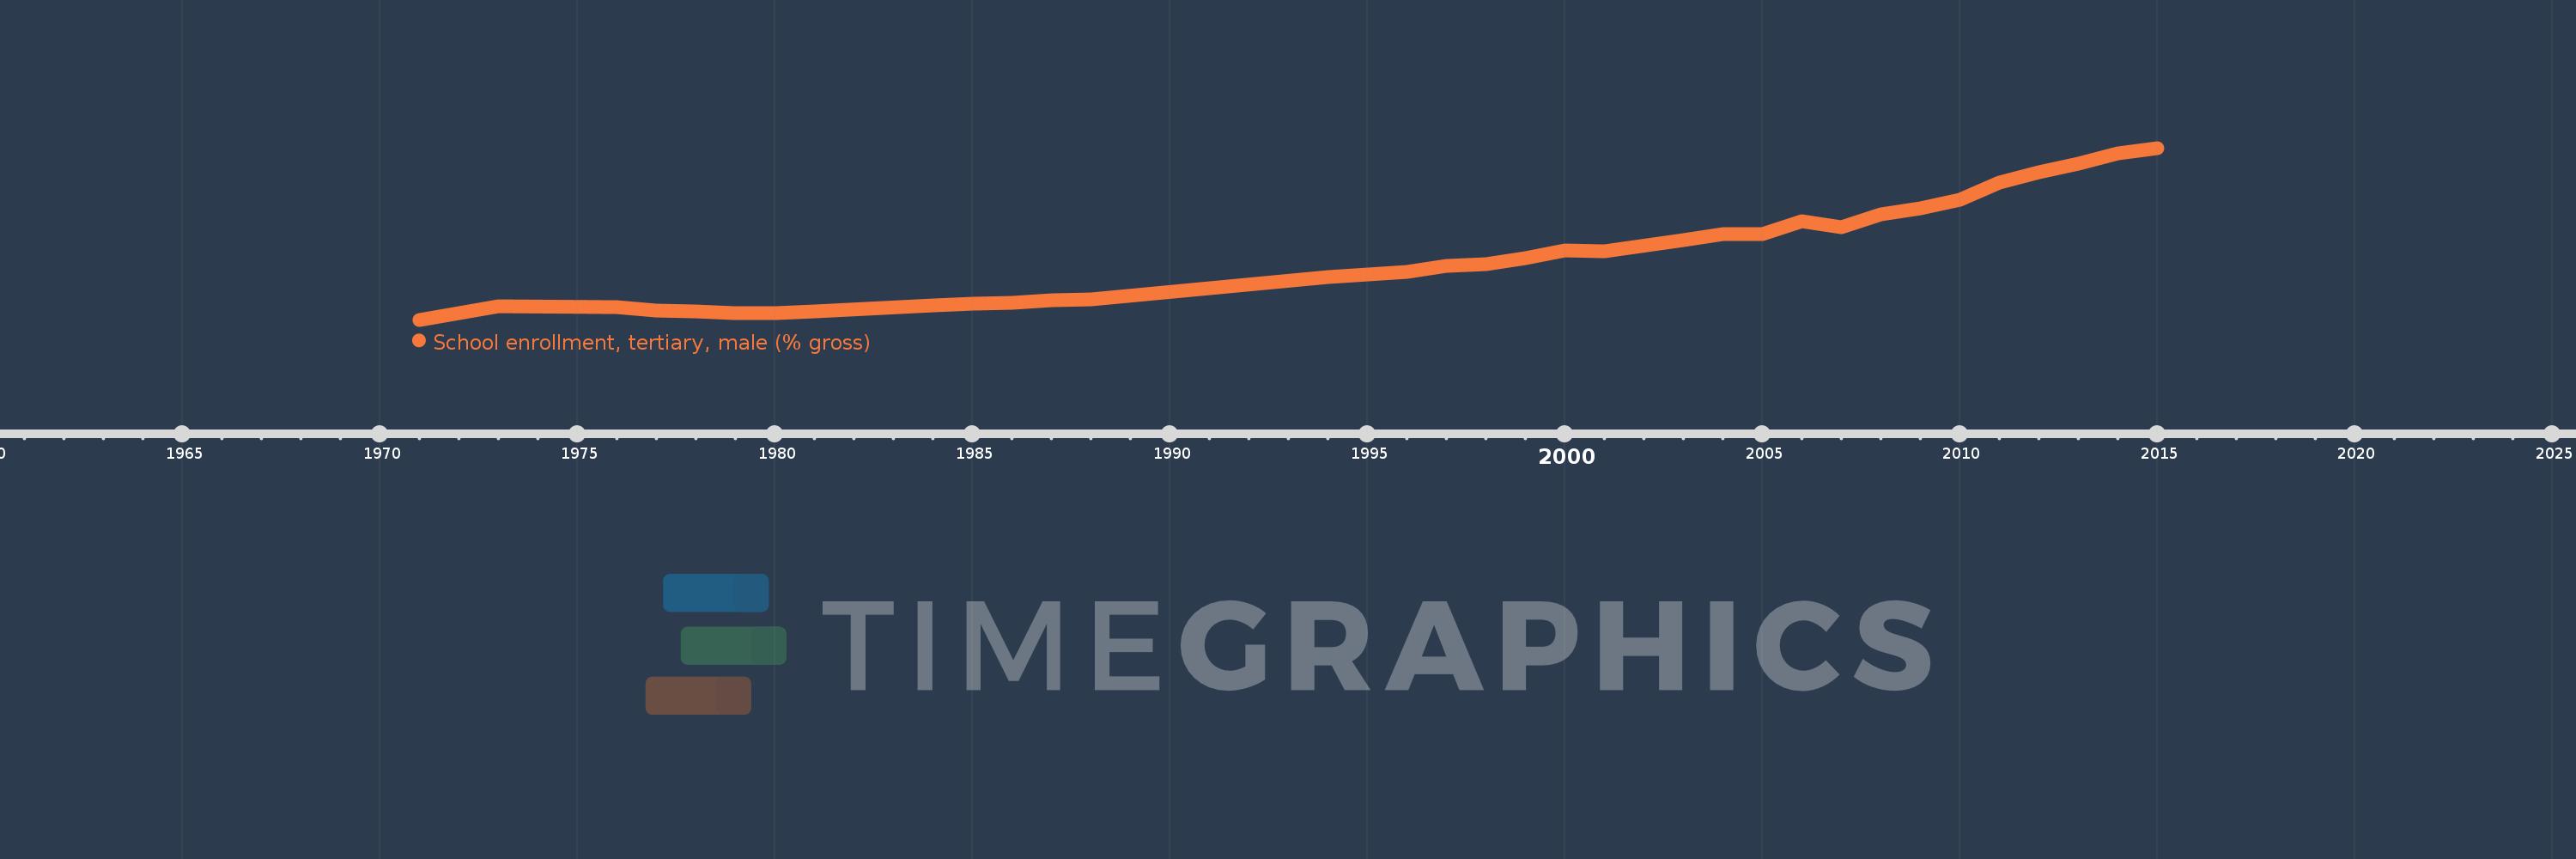
School enrollment, tertiary, male (% gross)
2015,2014,2013,2012,2011,2010,2009,2008,2007,2006,2005,2004,2003,2001,2000,1999,1998,1997,1996,1995,1994,1988,1987,1986,1985,1984,1981,1980,1979,1978,1977,1976,1973,1972,1971
This statistics in other country:
AfghanistanAlbaniaAlgeriaAngolaAntigua and BarbudaArab WorldArgentinaArmeniaArubaAustraliaAustriaAzerbaijanBahamas, TheBahrainBangladeshBarbadosBelarusBelgiumBelizeBeninBermudaBhutanBoliviaBosnia and HerzegovinaBotswanaBrazilBrunei DarussalamBulgariaBurkina FasoBurundiCabo VerdeCambodiaCameroonCanadaCaribbean small statesCentral African RepublicCentral Europe and the BalticsChadChileChinaColombiaComorosCongo, Dem. Rep.Congo, Rep.Costa RicaCote d'IvoireCroatiaCubaCuracaoCyprusCzech RepublicDenmarkDjiboutiDominicaDominican RepublicEarly-demographic dividendEast Asia & PacificEast Asia & Pacific (excluding high income)East Asia & Pacific (IDA & IBRD countries)EcuadorEgypt, Arab Rep.El SalvadorEquatorial GuineaEritreaEstoniaEthiopiaEuro areaEurope & Central AsiaEurope & Central Asia (excluding high income)Europe & Central Asia (IDA & IBRD countries)European UnionFijiFinlandFragile and conflict affected situationsFranceGabonGambia, TheGeorgiaGermanyGhanaGreeceGrenadaGuatemalaGuineaGuinea-BissauGuyanaHaitiHeavily indebted poor countries (HIPC)High incomeHondurasHong Kong SAR, ChinaHungaryIBRD onlyIcelandIDA & IBRD totalIDA blendIDA onlyIDA totalIndiaIndonesiaIran, Islamic Rep.IraqIrelandIsraelItalyJamaicaJapanJordanKazakhstanKenyaKorea, Dem. People’s Rep.Korea, Rep.KuwaitKyrgyz RepublicLao PDRLate-demographic dividendLatin America & Caribbean Latin America & Caribbean (excluding high income)Latin America & the Caribbean (IDA & IBRD countries)LatviaLeast developed countries: UN classificationLebanonLesothoLiberiaLibyaLiechtensteinLithuaniaLow & middle incomeLow incomeLower middle incomeLuxembourgMacao SAR, ChinaMacedonia, FYRMadagascarMalawiMaldivesMaliMaltaMarshall IslandsMauritaniaMauritiusMexicoMicronesia, Fed. Sts.Middle East & North AfricaMiddle East & North Africa (excluding high income)Middle East & North Africa (IDA & IBRD countries)Middle incomeMoldovaMongoliaMontenegroMoroccoMozambiqueMyanmarNamibiaNepalNetherlandsNew ZealandNicaraguaNigerNigeriaNorth AmericaNorwayOECD membersOmanOther small statesPacific island small statesPakistanPalauPanamaPapua New GuineaParaguayPeruPhilippinesPolandPortugalPost-demographic dividendPre-demographic dividendPuerto RicoQatarRomaniaRussian FederationRwandaSamoaSan MarinoSao Tome and PrincipeSaudi ArabiaSenegalSerbiaSeychellesSierra LeoneSingaporeSlovak RepublicSloveniaSmall statesSomaliaSouth AfricaSouth AsiaSouth Asia (IDA & IBRD)SpainSri LankaSt. Kitts and NevisSt. LuciaSt. Vincent and the GrenadinesSub-Saharan Africa Sub-Saharan Africa (excluding high income)Sub-Saharan Africa (IDA & IBRD countries)SudanSurinameSwazilandSwedenSwitzerlandSyrian Arab RepublicTajikistanTanzaniaThailandTimor-LesteTogoTongaTrinidad and TobagoTunisiaTurkeyTurkmenistanUgandaUkraineUnited Arab EmiratesUnited KingdomUnited StatesUpper middle incomeUruguayUzbekistanVanuatuVenezuela, RBVietnamWest Bank and GazaWorldYemen, Rep.ZambiaZimbabwe Timeline:
This timeline shows a graph from 1971 to 2015 of Chile. No data until 1970. Number of actual observations by date: 35.
Source name:
World Development Indicators
Source organization:
United Nations Educational, Scientific, and Cultural Organization (UNESCO) Institute for Statistics.
Categories, topics:
Education, Gender
Last updated:
apr 23, 2017
Indicators value changes by year
Minimum:
10.986
jan 1, 1971
Maximum:
81.253
jan 1, 2015
At the date of observation
Value
Absolute change
Change from previous value
jan 1, 1971
10.986
+10.986
0.0%
jan 1, 1972
13.713
+2.727
24.83%
jan 1, 1973
16.549
+2.836
20.68%
jan 1, 1976
16.029
-0.52
-3.14%
jan 1, 1977
14.679
-1.35
-8.42%
jan 1, 1978
14.23
-0.449
-3.06%
jan 1, 1979
13.823
-0.407
-2.86%
jan 1, 1980
13.705
-0.117
-0.85%
jan 1, 1981
14.422
+0.717
5.23%
jan 1, 1984
16.997
+2.575
17.86%
jan 1, 1985
17.557
+0.56
3.29%
jan 1, 1986
17.883
+0.327
1.86%
jan 1, 1987
18.944
+1.061
5.93%
jan 1, 1988
19.469
+0.525
2.77%
jan 1, 1994
28.577
+9.108
46.78%
jan 1, 1995
29.553
+0.976
3.41%
jan 1, 1996
30.517
+0.964
3.26%
jan 1, 1997
32.961
+2.444
8.01%
jan 1, 1998
33.893
+0.932
2.83%
jan 1, 1999
36.17
+2.276
6.72%
jan 1, 2000
39.209
+3.04
8.4%
jan 1, 2001
39.009
-0.2
-0.51%
jan 1, 2003
43.507
+4.498
11.53%
jan 1, 2004
46.149
+2.642
6.07%
jan 1, 2005
46.144
-0.005
-0.01%
jan 1, 2006
51.339
+5.195
11.26%
jan 1, 2007
48.874
-2.465
-4.8%
jan 1, 2008
54.226
+5.352
10.95%
jan 1, 2009
56.508
+2.283
4.21%
jan 1, 2010
60.023
+3.515
6.22%
jan 1, 2011
67.114
+7.091
11.81%
jan 1, 2012
71.304
+4.19
6.24%
jan 1, 2013
74.693
+3.389
4.75%
jan 1, 2014
78.902
+4.209
5.64%
jan 1, 2015
81.253
+2.351
2.98%
Ranking of countries by current statistics by years


Comments: