29
/
en
AIzaSyAYiBZKx7MnpbEhh9jyipgxe19OcubqV5w
April 1, 2024
25313
Caribbean small states
CSS
false
2
1
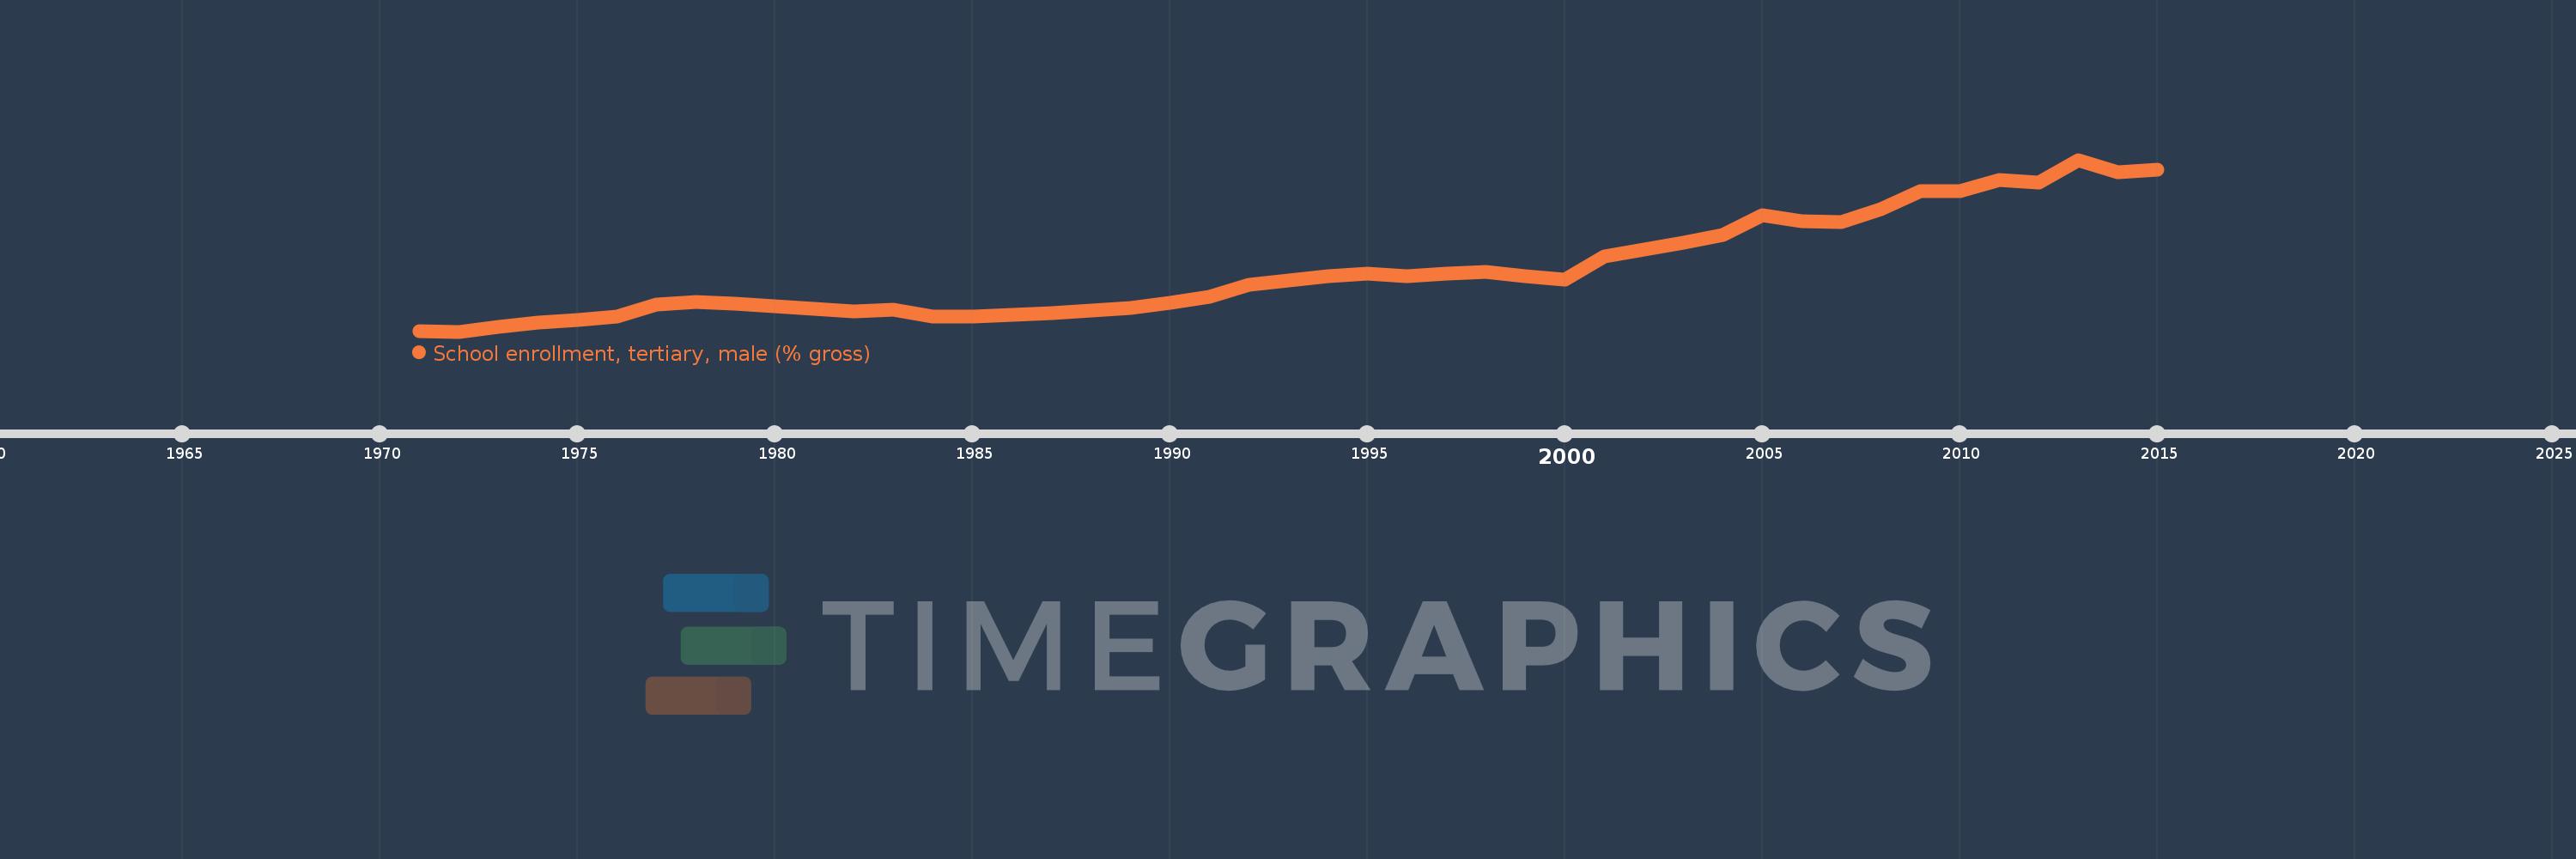
School enrollment, tertiary, male (% gross)
2015,2014,2013,2012,2011,2010,2009,2008,2007,2006,2005,2004,2003,2002,2001,2000,1999,1998,1997,1996,1995,1994,1993,1992,1991,1990,1989,1988,1987,1986,1985,1984,1983,1982,1981,1980,1979,1978,1977,1976,1975,1974,1973,1972,1971
This statistics in other country:
AfghanistanAlbaniaAlgeriaAngolaAntigua and BarbudaArab WorldArgentinaArmeniaArubaAustraliaAustriaAzerbaijanBahamas, TheBahrainBangladeshBarbadosBelarusBelgiumBelizeBeninBermudaBhutanBoliviaBosnia and HerzegovinaBotswanaBrazilBrunei DarussalamBulgariaBurkina FasoBurundiCabo VerdeCambodiaCameroonCanadaCaribbean small statesCentral African RepublicCentral Europe and the BalticsChadChileChinaColombiaComorosCongo, Dem. Rep.Congo, Rep.Costa RicaCote d'IvoireCroatiaCubaCuracaoCyprusCzech RepublicDenmarkDjiboutiDominicaDominican RepublicEarly-demographic dividendEast Asia & PacificEast Asia & Pacific (excluding high income)East Asia & Pacific (IDA & IBRD countries)EcuadorEgypt, Arab Rep.El SalvadorEquatorial GuineaEritreaEstoniaEthiopiaEuro areaEurope & Central AsiaEurope & Central Asia (excluding high income)Europe & Central Asia (IDA & IBRD countries)European UnionFijiFinlandFragile and conflict affected situationsFranceGabonGambia, TheGeorgiaGermanyGhanaGreeceGrenadaGuatemalaGuineaGuinea-BissauGuyanaHaitiHeavily indebted poor countries (HIPC)High incomeHondurasHong Kong SAR, ChinaHungaryIBRD onlyIcelandIDA & IBRD totalIDA blendIDA onlyIDA totalIndiaIndonesiaIran, Islamic Rep.IraqIrelandIsraelItalyJamaicaJapanJordanKazakhstanKenyaKorea, Dem. People’s Rep.Korea, Rep.KuwaitKyrgyz RepublicLao PDRLate-demographic dividendLatin America & Caribbean Latin America & Caribbean (excluding high income)Latin America & the Caribbean (IDA & IBRD countries)LatviaLeast developed countries: UN classificationLebanonLesothoLiberiaLibyaLiechtensteinLithuaniaLow & middle incomeLow incomeLower middle incomeLuxembourgMacao SAR, ChinaMacedonia, FYRMadagascarMalawiMaldivesMaliMaltaMarshall IslandsMauritaniaMauritiusMexicoMicronesia, Fed. Sts.Middle East & North AfricaMiddle East & North Africa (excluding high income)Middle East & North Africa (IDA & IBRD countries)Middle incomeMoldovaMongoliaMontenegroMoroccoMozambiqueMyanmarNamibiaNepalNetherlandsNew ZealandNicaraguaNigerNigeriaNorth AmericaNorwayOECD membersOmanOther small statesPacific island small statesPakistanPalauPanamaPapua New GuineaParaguayPeruPhilippinesPolandPortugalPost-demographic dividendPre-demographic dividendPuerto RicoQatarRomaniaRussian FederationRwandaSamoaSan MarinoSao Tome and PrincipeSaudi ArabiaSenegalSerbiaSeychellesSierra LeoneSingaporeSlovak RepublicSloveniaSmall statesSomaliaSouth AfricaSouth AsiaSouth Asia (IDA & IBRD)SpainSri LankaSt. Kitts and NevisSt. LuciaSt. Vincent and the GrenadinesSub-Saharan Africa Sub-Saharan Africa (excluding high income)Sub-Saharan Africa (IDA & IBRD countries)SudanSurinameSwazilandSwedenSwitzerlandSyrian Arab RepublicTajikistanTanzaniaThailandTimor-LesteTogoTongaTrinidad and TobagoTunisiaTurkeyTurkmenistanUgandaUkraineUnited Arab EmiratesUnited KingdomUnited StatesUpper middle incomeUruguayUzbekistanVanuatuVenezuela, RBVietnamWest Bank and GazaWorldYemen, Rep.ZambiaZimbabwe Timeline:
This timeline shows a graph from 1971 to 2015 of Caribbean small states. No data until 1970. Number of actual observations by date: 45.
Source name:
World Development Indicators
Source organization:
United Nations Educational, Scientific, and Cultural Organization (UNESCO) Institute for Statistics.
Categories, topics:
Education, Gender
Last updated:
apr 23, 2017
Indicators value changes by year
Maximum:
15.739
jan 1, 2013
At the date of observation
Value
Absolute change
Change from previous value
jan 1, 1971
4.773
+4.773
0.0%
jan 1, 1972
4.719
-0.054
-1.14%
jan 1, 1973
5.029
+0.31
6.58%
jan 1, 1974
5.323
+0.293
5.83%
jan 1, 1975
5.447
+0.124
2.33%
jan 1, 1976
5.704
+0.257
4.72%
jan 1, 1977
6.46
+0.756
13.26%
jan 1, 1978
6.597
+0.137
2.12%
jan 1, 1979
6.496
-0.101
-1.53%
jan 1, 1980
6.362
-0.134
-2.07%
jan 1, 1981
6.159
-0.202
-3.18%
jan 1, 1982
5.989
-0.17
-2.76%
jan 1, 1983
6.132
+0.143
2.39%
jan 1, 1984
5.677
-0.456
-7.43%
jan 1, 1985
5.704
+0.027
0.48%
jan 1, 1986
5.805
+0.101
1.76%
jan 1, 1987
5.91
+0.105
1.82%
jan 1, 1988
6.08
+0.17
2.87%
jan 1, 1989
6.258
+0.178
2.93%
jan 1, 1990
6.557
+0.299
4.78%
jan 1, 1991
6.932
+0.375
5.72%
jan 1, 1992
7.7
+0.768
11.08%
jan 1, 1993
8.014
+0.315
4.09%
jan 1, 1994
8.247
+0.233
2.91%
jan 1, 1995
8.427
+0.18
2.18%
jan 1, 1996
8.285
-0.143
-1.69%
jan 1, 1997
8.458
+0.173
2.09%
jan 1, 1998
8.53
+0.072
0.85%
jan 1, 1999
8.289
-0.241
-2.82%
jan 1, 2000
8.077
-0.212
-2.56%
jan 1, 2001
9.517
+1.441
17.84%
jan 1, 2002
9.956
+0.439
4.61%
jan 1, 2003
10.398
+0.442
4.44%
jan 1, 2004
10.941
+0.543
5.22%
jan 1, 2005
12.192
+1.251
11.43%
jan 1, 2006
11.824
-0.368
-3.02%
jan 1, 2007
11.761
-0.063
-0.53%
jan 1, 2008
12.595
+0.835
7.1%
jan 1, 2009
13.706
+1.11
8.82%
jan 1, 2010
13.701
-0.005
-0.04%
jan 1, 2011
14.455
+0.754
5.5%
jan 1, 2012
14.292
-0.163
-1.13%
jan 1, 2013
15.739
+1.447
10.13%
jan 1, 2014
14.952
-0.787
-5.0%
jan 1, 2015
15.087
+0.135
0.9%
Ranking of countries by current statistics by years


Comments: