29
/
en
AIzaSyAYiBZKx7MnpbEhh9jyipgxe19OcubqV5w
April 1, 2024
48546
Middle East & North Africa
MEA
false
2
1
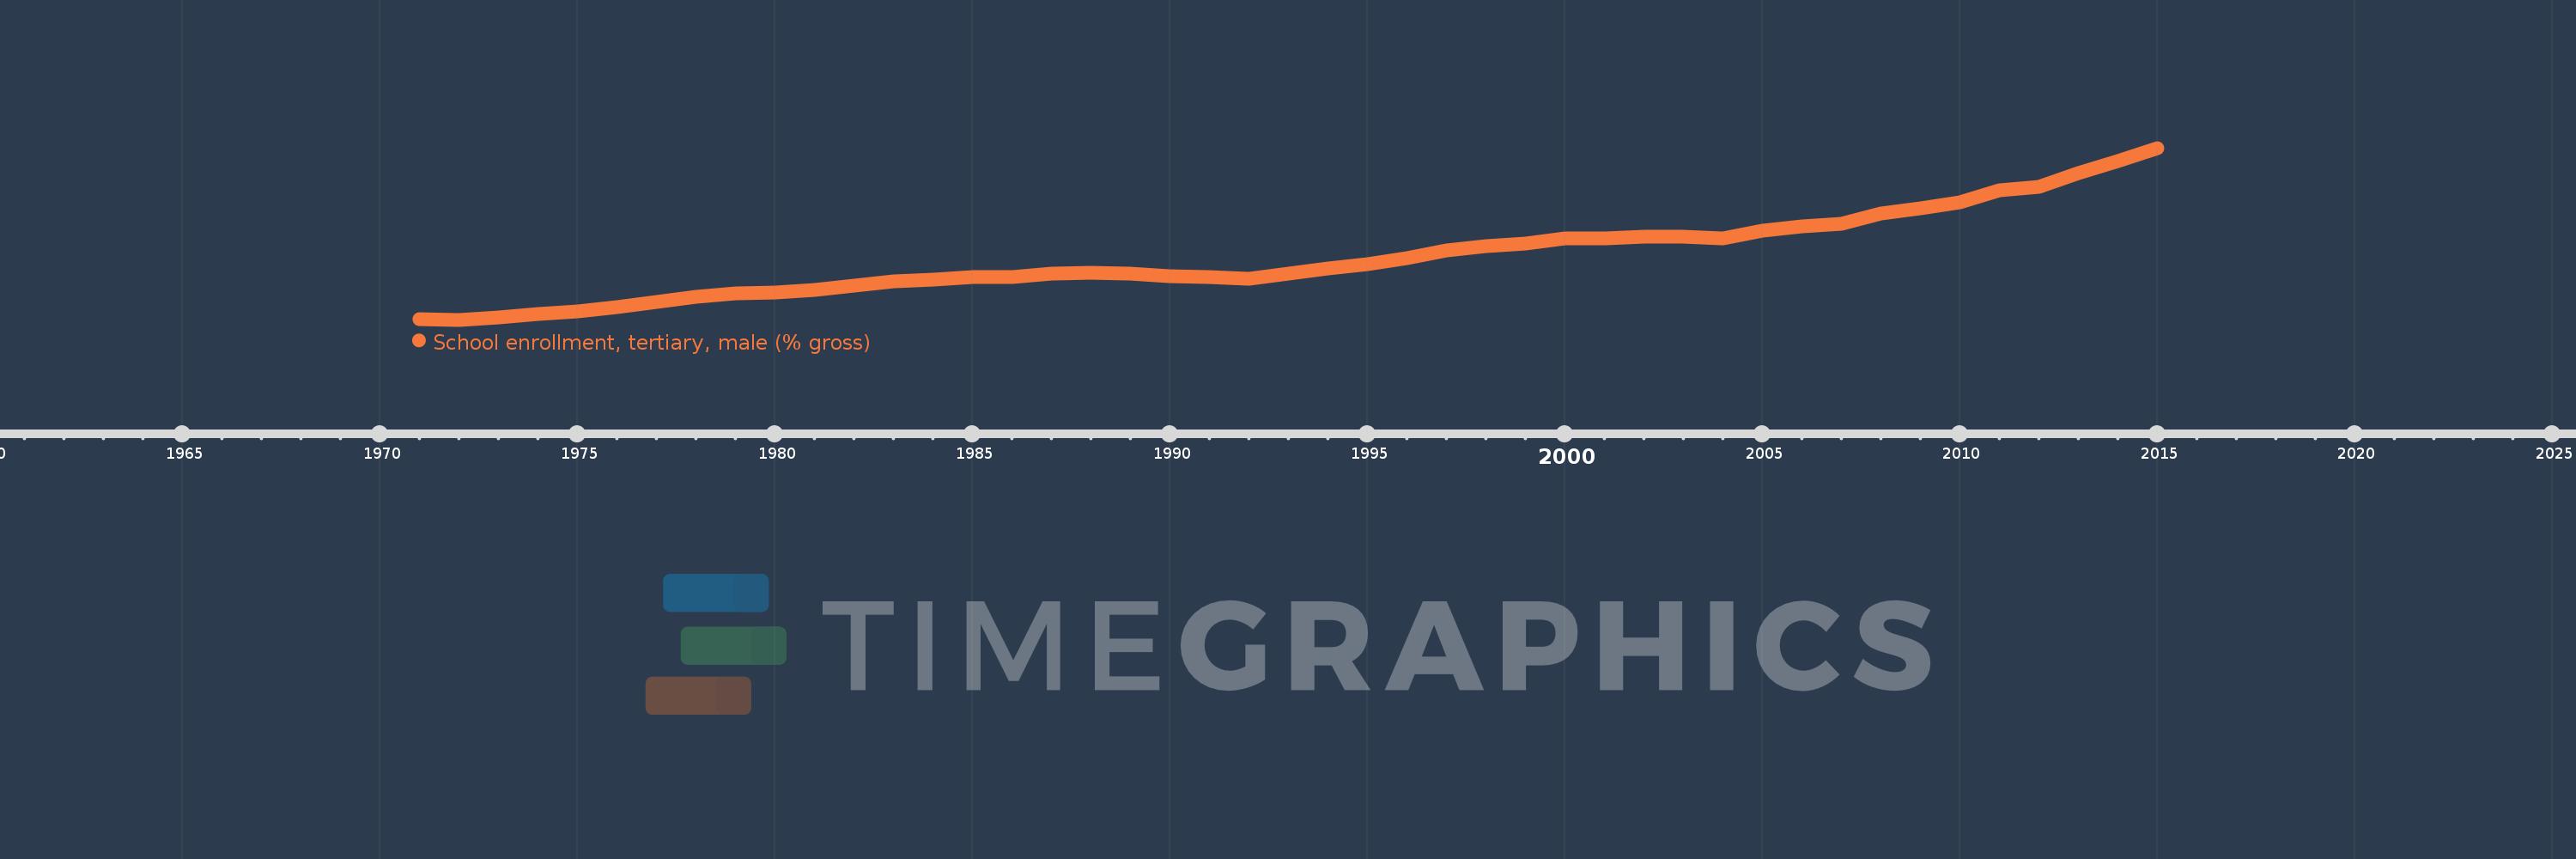
School enrollment, tertiary, male (% gross)
2015,2014,2013,2012,2011,2010,2009,2008,2007,2006,2005,2004,2003,2002,2001,2000,1999,1998,1997,1996,1995,1994,1993,1992,1991,1990,1989,1988,1987,1986,1985,1984,1983,1982,1981,1980,1979,1978,1977,1976,1975,1974,1973,1972,1971
This statistics in other country:
AfghanistanAlbaniaAlgeriaAngolaAntigua and BarbudaArab WorldArgentinaArmeniaArubaAustraliaAustriaAzerbaijanBahamas, TheBahrainBangladeshBarbadosBelarusBelgiumBelizeBeninBermudaBhutanBoliviaBosnia and HerzegovinaBotswanaBrazilBrunei DarussalamBulgariaBurkina FasoBurundiCabo VerdeCambodiaCameroonCanadaCaribbean small statesCentral African RepublicCentral Europe and the BalticsChadChileChinaColombiaComorosCongo, Dem. Rep.Congo, Rep.Costa RicaCote d'IvoireCroatiaCubaCuracaoCyprusCzech RepublicDenmarkDjiboutiDominicaDominican RepublicEarly-demographic dividendEast Asia & PacificEast Asia & Pacific (excluding high income)East Asia & Pacific (IDA & IBRD countries)EcuadorEgypt, Arab Rep.El SalvadorEquatorial GuineaEritreaEstoniaEthiopiaEuro areaEurope & Central AsiaEurope & Central Asia (excluding high income)Europe & Central Asia (IDA & IBRD countries)European UnionFijiFinlandFragile and conflict affected situationsFranceGabonGambia, TheGeorgiaGermanyGhanaGreeceGrenadaGuatemalaGuineaGuinea-BissauGuyanaHaitiHeavily indebted poor countries (HIPC)High incomeHondurasHong Kong SAR, ChinaHungaryIBRD onlyIcelandIDA & IBRD totalIDA blendIDA onlyIDA totalIndiaIndonesiaIran, Islamic Rep.IraqIrelandIsraelItalyJamaicaJapanJordanKazakhstanKenyaKorea, Dem. People’s Rep.Korea, Rep.KuwaitKyrgyz RepublicLao PDRLate-demographic dividendLatin America & Caribbean Latin America & Caribbean (excluding high income)Latin America & the Caribbean (IDA & IBRD countries)LatviaLeast developed countries: UN classificationLebanonLesothoLiberiaLibyaLiechtensteinLithuaniaLow & middle incomeLow incomeLower middle incomeLuxembourgMacao SAR, ChinaMacedonia, FYRMadagascarMalawiMaldivesMaliMaltaMarshall IslandsMauritaniaMauritiusMexicoMicronesia, Fed. Sts.Middle East & North AfricaMiddle East & North Africa (excluding high income)Middle East & North Africa (IDA & IBRD countries)Middle incomeMoldovaMongoliaMontenegroMoroccoMozambiqueMyanmarNamibiaNepalNetherlandsNew ZealandNicaraguaNigerNigeriaNorth AmericaNorwayOECD membersOmanOther small statesPacific island small statesPakistanPalauPanamaPapua New GuineaParaguayPeruPhilippinesPolandPortugalPost-demographic dividendPre-demographic dividendPuerto RicoQatarRomaniaRussian FederationRwandaSamoaSan MarinoSao Tome and PrincipeSaudi ArabiaSenegalSerbiaSeychellesSierra LeoneSingaporeSlovak RepublicSloveniaSmall statesSomaliaSouth AfricaSouth AsiaSouth Asia (IDA & IBRD)SpainSri LankaSt. Kitts and NevisSt. LuciaSt. Vincent and the GrenadinesSub-Saharan Africa Sub-Saharan Africa (excluding high income)Sub-Saharan Africa (IDA & IBRD countries)SudanSurinameSwazilandSwedenSwitzerlandSyrian Arab RepublicTajikistanTanzaniaThailandTimor-LesteTogoTongaTrinidad and TobagoTunisiaTurkeyTurkmenistanUgandaUkraineUnited Arab EmiratesUnited KingdomUnited StatesUpper middle incomeUruguayUzbekistanVanuatuVenezuela, RBVietnamWest Bank and GazaWorldYemen, Rep.ZambiaZimbabwe Timeline:
This timeline shows a graph from 1971 to 2015 of Middle East & North Africa. No data until 1970. Number of actual observations by date: 45.
Source name:
World Development Indicators
Source organization:
United Nations Educational, Scientific, and Cultural Organization (UNESCO) Institute for Statistics.
Categories, topics:
Education, Gender
Last updated:
apr 23, 2017
Indicators value changes by year
Maximum:
37.599
jan 1, 2015
At the date of observation
Value
Absolute change
Change from previous value
jan 1, 1971
7.796
+7.796
0.0%
jan 1, 1972
7.763
-0.033
-0.42%
jan 1, 1973
8.121
+0.357
4.6%
jan 1, 1974
8.709
+0.588
7.24%
jan 1, 1975
9.198
+0.49
5.62%
jan 1, 1976
9.929
+0.731
7.95%
jan 1, 1977
10.82
+0.891
8.97%
jan 1, 1978
11.731
+0.911
8.42%
jan 1, 1979
12.285
+0.554
4.73%
jan 1, 1980
12.442
+0.157
1.28%
jan 1, 1981
12.976
+0.534
4.29%
jan 1, 1982
13.725
+0.749
5.77%
jan 1, 1983
14.402
+0.678
4.94%
jan 1, 1984
14.709
+0.306
2.13%
jan 1, 1985
15.163
+0.454
3.09%
jan 1, 1986
15.178
+0.015
0.1%
jan 1, 1987
15.78
+0.602
3.97%
jan 1, 1988
15.937
+0.156
0.99%
jan 1, 1989
15.701
-0.236
-1.48%
jan 1, 1990
15.264
-0.437
-2.78%
jan 1, 1991
15.24
-0.024
-0.16%
jan 1, 1992
14.934
-0.306
-2.01%
jan 1, 1993
15.722
+0.788
5.28%
jan 1, 1994
16.685
+0.964
6.13%
jan 1, 1995
17.465
+0.78
4.67%
jan 1, 1996
18.394
+0.929
5.32%
jan 1, 1997
19.79
+1.396
7.59%
jan 1, 1998
20.485
+0.695
3.51%
jan 1, 1999
20.938
+0.453
2.21%
jan 1, 2000
21.945
+1.007
4.81%
jan 1, 2001
21.863
-0.082
-0.37%
jan 1, 2002
22.213
+0.35
1.6%
jan 1, 2003
22.238
+0.025
0.11%
jan 1, 2004
21.868
-0.37
-1.67%
jan 1, 2005
23.162
+1.294
5.92%
jan 1, 2006
24.029
+0.867
3.74%
jan 1, 2007
24.485
+0.456
1.9%
jan 1, 2008
26.203
+1.717
7.01%
jan 1, 2009
27.156
+0.954
3.64%
jan 1, 2010
28.113
+0.957
3.52%
jan 1, 2011
30.273
+2.16
7.68%
jan 1, 2012
30.891
+0.617
2.04%
jan 1, 2013
33.161
+2.271
7.35%
jan 1, 2014
35.332
+2.171
6.55%
jan 1, 2015
37.599
+2.266
6.41%
Ranking of countries by current statistics by years


Comments: