29
/
en
AIzaSyAYiBZKx7MnpbEhh9jyipgxe19OcubqV5w
April 1, 2024
45659
Low & middle income
LMY
false
2
1
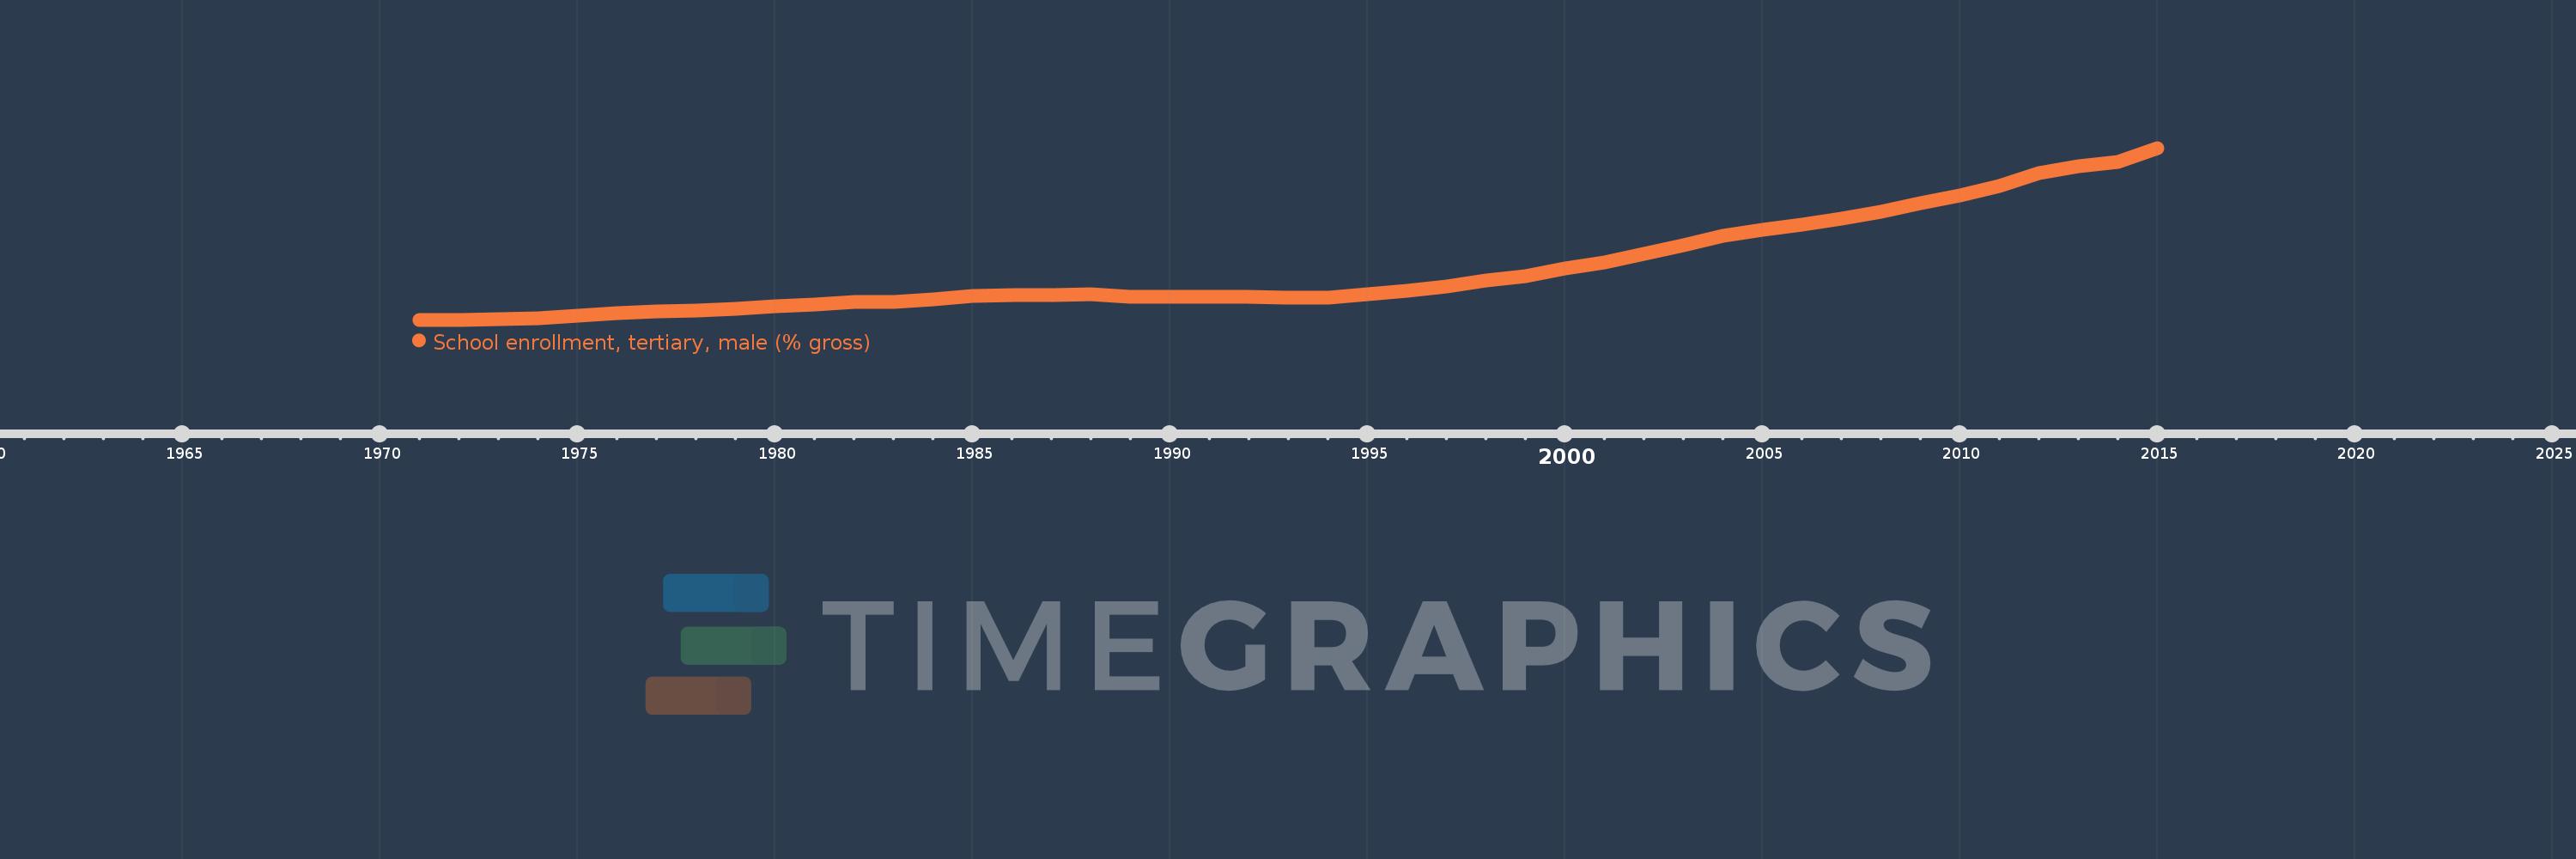
School enrollment, tertiary, male (% gross)
2015,2014,2013,2012,2011,2010,2009,2008,2007,2006,2005,2004,2003,2002,2001,2000,1999,1998,1997,1996,1995,1994,1993,1992,1991,1990,1989,1988,1987,1986,1985,1984,1983,1982,1981,1980,1979,1978,1977,1976,1975,1974,1973,1972,1971
This statistics in other country:
AfghanistanAlbaniaAlgeriaAngolaAntigua and BarbudaArab WorldArgentinaArmeniaArubaAustraliaAustriaAzerbaijanBahamas, TheBahrainBangladeshBarbadosBelarusBelgiumBelizeBeninBermudaBhutanBoliviaBosnia and HerzegovinaBotswanaBrazilBrunei DarussalamBulgariaBurkina FasoBurundiCabo VerdeCambodiaCameroonCanadaCaribbean small statesCentral African RepublicCentral Europe and the BalticsChadChileChinaColombiaComorosCongo, Dem. Rep.Congo, Rep.Costa RicaCote d'IvoireCroatiaCubaCuracaoCyprusCzech RepublicDenmarkDjiboutiDominicaDominican RepublicEarly-demographic dividendEast Asia & PacificEast Asia & Pacific (excluding high income)East Asia & Pacific (IDA & IBRD countries)EcuadorEgypt, Arab Rep.El SalvadorEquatorial GuineaEritreaEstoniaEthiopiaEuro areaEurope & Central AsiaEurope & Central Asia (excluding high income)Europe & Central Asia (IDA & IBRD countries)European UnionFijiFinlandFragile and conflict affected situationsFranceGabonGambia, TheGeorgiaGermanyGhanaGreeceGrenadaGuatemalaGuineaGuinea-BissauGuyanaHaitiHeavily indebted poor countries (HIPC)High incomeHondurasHong Kong SAR, ChinaHungaryIBRD onlyIcelandIDA & IBRD totalIDA blendIDA onlyIDA totalIndiaIndonesiaIran, Islamic Rep.IraqIrelandIsraelItalyJamaicaJapanJordanKazakhstanKenyaKorea, Dem. People’s Rep.Korea, Rep.KuwaitKyrgyz RepublicLao PDRLate-demographic dividendLatin America & Caribbean Latin America & Caribbean (excluding high income)Latin America & the Caribbean (IDA & IBRD countries)LatviaLeast developed countries: UN classificationLebanonLesothoLiberiaLibyaLiechtensteinLithuaniaLow & middle incomeLow incomeLower middle incomeLuxembourgMacao SAR, ChinaMacedonia, FYRMadagascarMalawiMaldivesMaliMaltaMarshall IslandsMauritaniaMauritiusMexicoMicronesia, Fed. Sts.Middle East & North AfricaMiddle East & North Africa (excluding high income)Middle East & North Africa (IDA & IBRD countries)Middle incomeMoldovaMongoliaMontenegroMoroccoMozambiqueMyanmarNamibiaNepalNetherlandsNew ZealandNicaraguaNigerNigeriaNorth AmericaNorwayOECD membersOmanOther small statesPacific island small statesPakistanPalauPanamaPapua New GuineaParaguayPeruPhilippinesPolandPortugalPost-demographic dividendPre-demographic dividendPuerto RicoQatarRomaniaRussian FederationRwandaSamoaSan MarinoSao Tome and PrincipeSaudi ArabiaSenegalSerbiaSeychellesSierra LeoneSingaporeSlovak RepublicSloveniaSmall statesSomaliaSouth AfricaSouth AsiaSouth Asia (IDA & IBRD)SpainSri LankaSt. Kitts and NevisSt. LuciaSt. Vincent and the GrenadinesSub-Saharan Africa Sub-Saharan Africa (excluding high income)Sub-Saharan Africa (IDA & IBRD countries)SudanSurinameSwazilandSwedenSwitzerlandSyrian Arab RepublicTajikistanTanzaniaThailandTimor-LesteTogoTongaTrinidad and TobagoTunisiaTurkeyTurkmenistanUgandaUkraineUnited Arab EmiratesUnited KingdomUnited StatesUpper middle incomeUruguayUzbekistanVanuatuVenezuela, RBVietnamWest Bank and GazaWorldYemen, Rep.ZambiaZimbabwe Timeline:
This timeline shows a graph from 1971 to 2015 of Low & middle income. No data until 1970. Number of actual observations by date: 45.
Source name:
World Development Indicators
Source organization:
United Nations Educational, Scientific, and Cultural Organization (UNESCO) Institute for Statistics.
Categories, topics:
Education, Gender
Last updated:
apr 23, 2017
Indicators value changes by year
Maximum:
28.126
jan 1, 2015
At the date of observation
Value
Absolute change
Change from previous value
jan 1, 1971
6.649
+6.649
0.0%
jan 1, 1972
6.655
+0.006
0.08%
jan 1, 1973
6.722
+0.067
1.0%
jan 1, 1974
6.882
+0.16
2.38%
jan 1, 1975
7.163
+0.281
4.08%
jan 1, 1976
7.49
+0.327
4.57%
jan 1, 1977
7.711
+0.221
2.95%
jan 1, 1978
7.814
+0.103
1.33%
jan 1, 1979
8.039
+0.226
2.89%
jan 1, 1980
8.342
+0.302
3.76%
jan 1, 1981
8.515
+0.173
2.08%
jan 1, 1982
8.849
+0.334
3.92%
jan 1, 1983
8.916
+0.067
0.76%
jan 1, 1984
9.15
+0.234
2.62%
jan 1, 1985
9.611
+0.461
5.04%
jan 1, 1986
9.753
+0.142
1.48%
jan 1, 1987
9.753
-0.001
-0.01%
jan 1, 1988
9.856
+0.103
1.06%
jan 1, 1989
9.528
-0.328
-3.33%
jan 1, 1990
9.542
+0.014
0.14%
jan 1, 1991
9.566
+0.024
0.26%
jan 1, 1992
9.558
-0.008
-0.08%
jan 1, 1993
9.46
-0.097
-1.02%
jan 1, 1994
9.444
-0.016
-0.17%
jan 1, 1995
9.795
+0.351
3.71%
jan 1, 1996
10.317
+0.522
5.33%
jan 1, 1997
10.83
+0.512
4.96%
jan 1, 1998
11.567
+0.738
6.81%
jan 1, 1999
12.136
+0.568
4.91%
jan 1, 2000
13.012
+0.876
7.22%
jan 1, 2001
13.826
+0.814
6.26%
jan 1, 2002
14.898
+1.072
7.76%
jan 1, 2003
15.925
+1.026
6.89%
jan 1, 2004
17.102
+1.178
7.4%
jan 1, 2005
17.917
+0.815
4.76%
jan 1, 2006
18.537
+0.62
3.46%
jan 1, 2007
19.253
+0.717
3.87%
jan 1, 2008
20.166
+0.913
4.74%
jan 1, 2009
21.196
+1.03
5.11%
jan 1, 2010
22.182
+0.986
4.65%
jan 1, 2011
23.363
+1.182
5.33%
jan 1, 2012
24.983
+1.62
6.93%
jan 1, 2013
25.86
+0.877
3.51%
jan 1, 2014
26.39
+0.53
2.05%
jan 1, 2015
28.126
+1.736
6.58%
Ranking of countries by current statistics by years


Comments: