29
/
en
AIzaSyAYiBZKx7MnpbEhh9jyipgxe19OcubqV5w
April 1, 2024
29498
East Asia & Pacific (IDA & IBRD countries)
TEA
false
2
1
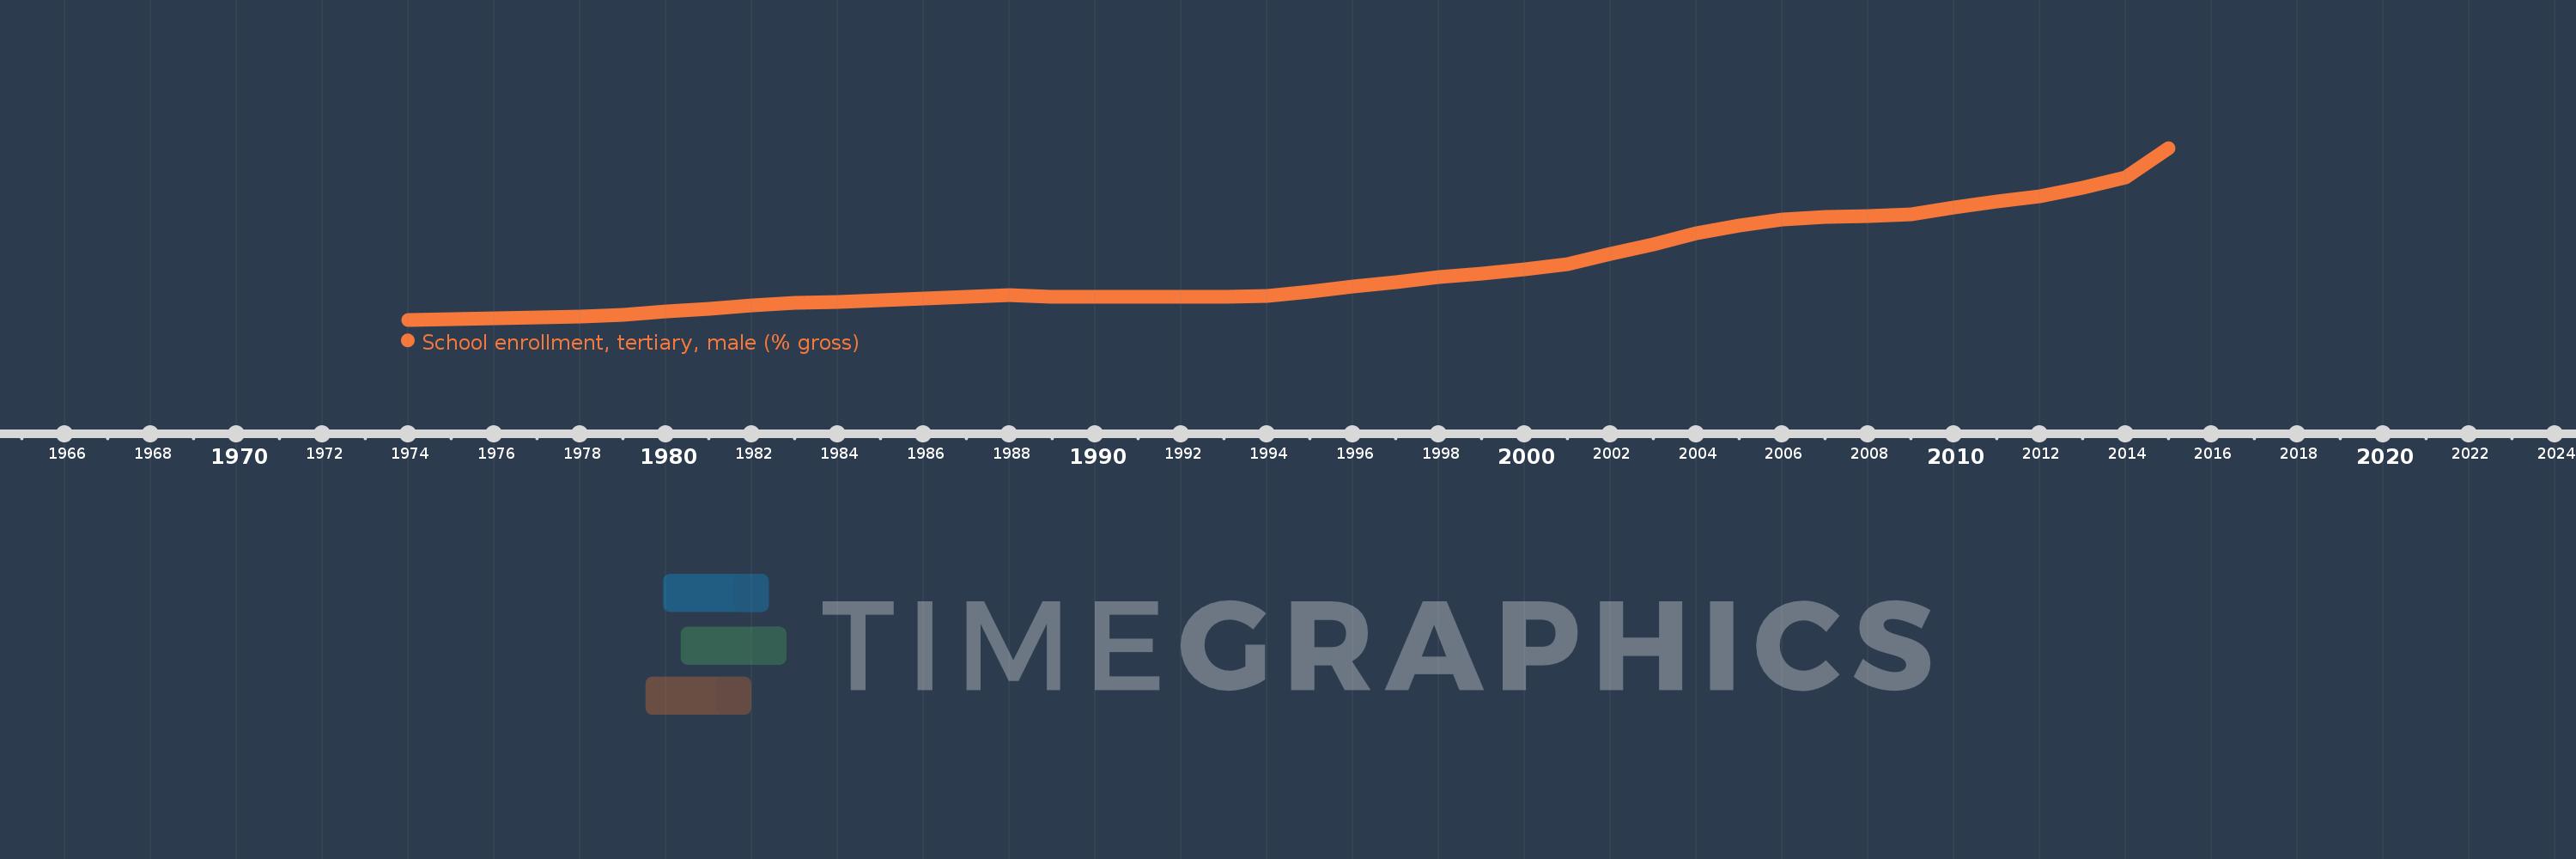
School enrollment, tertiary, male (% gross)
2015,2014,2013,2012,2011,2010,2009,2008,2007,2006,2005,2004,2003,2002,2001,2000,1999,1998,1997,1996,1995,1994,1993,1992,1991,1990,1989,1988,1987,1986,1985,1984,1983,1982,1981,1980,1979,1978,1977,1976,1975,1974
This statistics in other country:
AfghanistanAlbaniaAlgeriaAngolaAntigua and BarbudaArab WorldArgentinaArmeniaArubaAustraliaAustriaAzerbaijanBahamas, TheBahrainBangladeshBarbadosBelarusBelgiumBelizeBeninBermudaBhutanBoliviaBosnia and HerzegovinaBotswanaBrazilBrunei DarussalamBulgariaBurkina FasoBurundiCabo VerdeCambodiaCameroonCanadaCaribbean small statesCentral African RepublicCentral Europe and the BalticsChadChileChinaColombiaComorosCongo, Dem. Rep.Congo, Rep.Costa RicaCote d'IvoireCroatiaCubaCuracaoCyprusCzech RepublicDenmarkDjiboutiDominicaDominican RepublicEarly-demographic dividendEast Asia & PacificEast Asia & Pacific (excluding high income)East Asia & Pacific (IDA & IBRD countries)EcuadorEgypt, Arab Rep.El SalvadorEquatorial GuineaEritreaEstoniaEthiopiaEuro areaEurope & Central AsiaEurope & Central Asia (excluding high income)Europe & Central Asia (IDA & IBRD countries)European UnionFijiFinlandFragile and conflict affected situationsFranceGabonGambia, TheGeorgiaGermanyGhanaGreeceGrenadaGuatemalaGuineaGuinea-BissauGuyanaHaitiHeavily indebted poor countries (HIPC)High incomeHondurasHong Kong SAR, ChinaHungaryIBRD onlyIcelandIDA & IBRD totalIDA blendIDA onlyIDA totalIndiaIndonesiaIran, Islamic Rep.IraqIrelandIsraelItalyJamaicaJapanJordanKazakhstanKenyaKorea, Dem. People’s Rep.Korea, Rep.KuwaitKyrgyz RepublicLao PDRLate-demographic dividendLatin America & Caribbean Latin America & Caribbean (excluding high income)Latin America & the Caribbean (IDA & IBRD countries)LatviaLeast developed countries: UN classificationLebanonLesothoLiberiaLibyaLiechtensteinLithuaniaLow & middle incomeLow incomeLower middle incomeLuxembourgMacao SAR, ChinaMacedonia, FYRMadagascarMalawiMaldivesMaliMaltaMarshall IslandsMauritaniaMauritiusMexicoMicronesia, Fed. Sts.Middle East & North AfricaMiddle East & North Africa (excluding high income)Middle East & North Africa (IDA & IBRD countries)Middle incomeMoldovaMongoliaMontenegroMoroccoMozambiqueMyanmarNamibiaNepalNetherlandsNew ZealandNicaraguaNigerNigeriaNorth AmericaNorwayOECD membersOmanOther small statesPacific island small statesPakistanPalauPanamaPapua New GuineaParaguayPeruPhilippinesPolandPortugalPost-demographic dividendPre-demographic dividendPuerto RicoQatarRomaniaRussian FederationRwandaSamoaSan MarinoSao Tome and PrincipeSaudi ArabiaSenegalSerbiaSeychellesSierra LeoneSingaporeSlovak RepublicSloveniaSmall statesSomaliaSouth AfricaSouth AsiaSouth Asia (IDA & IBRD)SpainSri LankaSt. Kitts and NevisSt. LuciaSt. Vincent and the GrenadinesSub-Saharan Africa Sub-Saharan Africa (excluding high income)Sub-Saharan Africa (IDA & IBRD countries)SudanSurinameSwazilandSwedenSwitzerlandSyrian Arab RepublicTajikistanTanzaniaThailandTimor-LesteTogoTongaTrinidad and TobagoTunisiaTurkeyTurkmenistanUgandaUkraineUnited Arab EmiratesUnited KingdomUnited StatesUpper middle incomeUruguayUzbekistanVanuatuVenezuela, RBVietnamWest Bank and GazaWorldYemen, Rep.ZambiaZimbabwe Timeline:
This timeline shows a graph from 1974 to 2015 of East Asia & Pacific (IDA & IBRD countries). No data until 1973. Number of actual observations by date: 42.
Source name:
World Development Indicators
Source organization:
United Nations Educational, Scientific, and Cultural Organization (UNESCO) Institute for Statistics.
Categories, topics:
Education, Gender
Last updated:
apr 23, 2017
Indicators value changes by year
Maximum:
33.933
jan 1, 2015
At the date of observation
Value
Absolute change
Change from previous value
jan 1, 1974
1.367
+1.367
0.0%
jan 1, 1975
1.543
+0.176
12.87%
jan 1, 1976
1.708
+0.165
10.68%
jan 1, 1977
1.862
+0.155
9.06%
jan 1, 1978
2.009
+0.147
7.87%
jan 1, 1979
2.344
+0.335
16.67%
jan 1, 1980
2.952
+0.609
25.98%
jan 1, 1981
3.393
+0.44
14.91%
jan 1, 1982
4.062
+0.67
19.74%
jan 1, 1983
4.548
+0.486
11.96%
jan 1, 1984
4.705
+0.157
3.45%
jan 1, 1985
5.026
+0.321
6.82%
jan 1, 1986
5.407
+0.381
7.58%
jan 1, 1987
5.778
+0.371
6.87%
jan 1, 1988
5.967
+0.188
3.26%
jan 1, 1989
5.742
-0.225
-3.76%
jan 1, 1990
5.778
+0.036
0.63%
jan 1, 1991
5.732
-0.047
-0.81%
jan 1, 1992
5.697
-0.035
-0.61%
jan 1, 1993
5.662
-0.034
-0.6%
jan 1, 1994
5.828
+0.166
2.93%
jan 1, 1995
6.76
+0.932
15.99%
jan 1, 1996
7.699
+0.939
13.89%
jan 1, 1997
8.522
+0.824
10.7%
jan 1, 1998
9.381
+0.858
10.07%
jan 1, 1999
10.051
+0.67
7.14%
jan 1, 2000
10.922
+0.872
8.67%
jan 1, 2001
11.935
+1.013
9.27%
jan 1, 2002
13.807
+1.872
15.68%
jan 1, 2003
15.624
+1.817
13.16%
jan 1, 2004
17.718
+2.094
13.4%
jan 1, 2005
19.214
+1.496
8.44%
jan 1, 2006
20.366
+1.152
6.0%
jan 1, 2007
20.833
+0.467
2.29%
jan 1, 2008
20.962
+0.129
0.62%
jan 1, 2009
21.334
+0.372
1.78%
jan 1, 2010
22.612
+1.278
5.99%
jan 1, 2011
23.843
+1.231
5.44%
jan 1, 2012
24.838
+0.995
4.17%
jan 1, 2013
26.474
+1.635
6.58%
jan 1, 2014
28.303
+1.83
6.91%
jan 1, 2015
33.933
+5.63
19.89%
Ranking of countries by current statistics by years


Comments: