29
/
en
AIzaSyAYiBZKx7MnpbEhh9jyipgxe19OcubqV5w
April 1, 2024
170478
Korea, Rep.
KOR
true
2
1
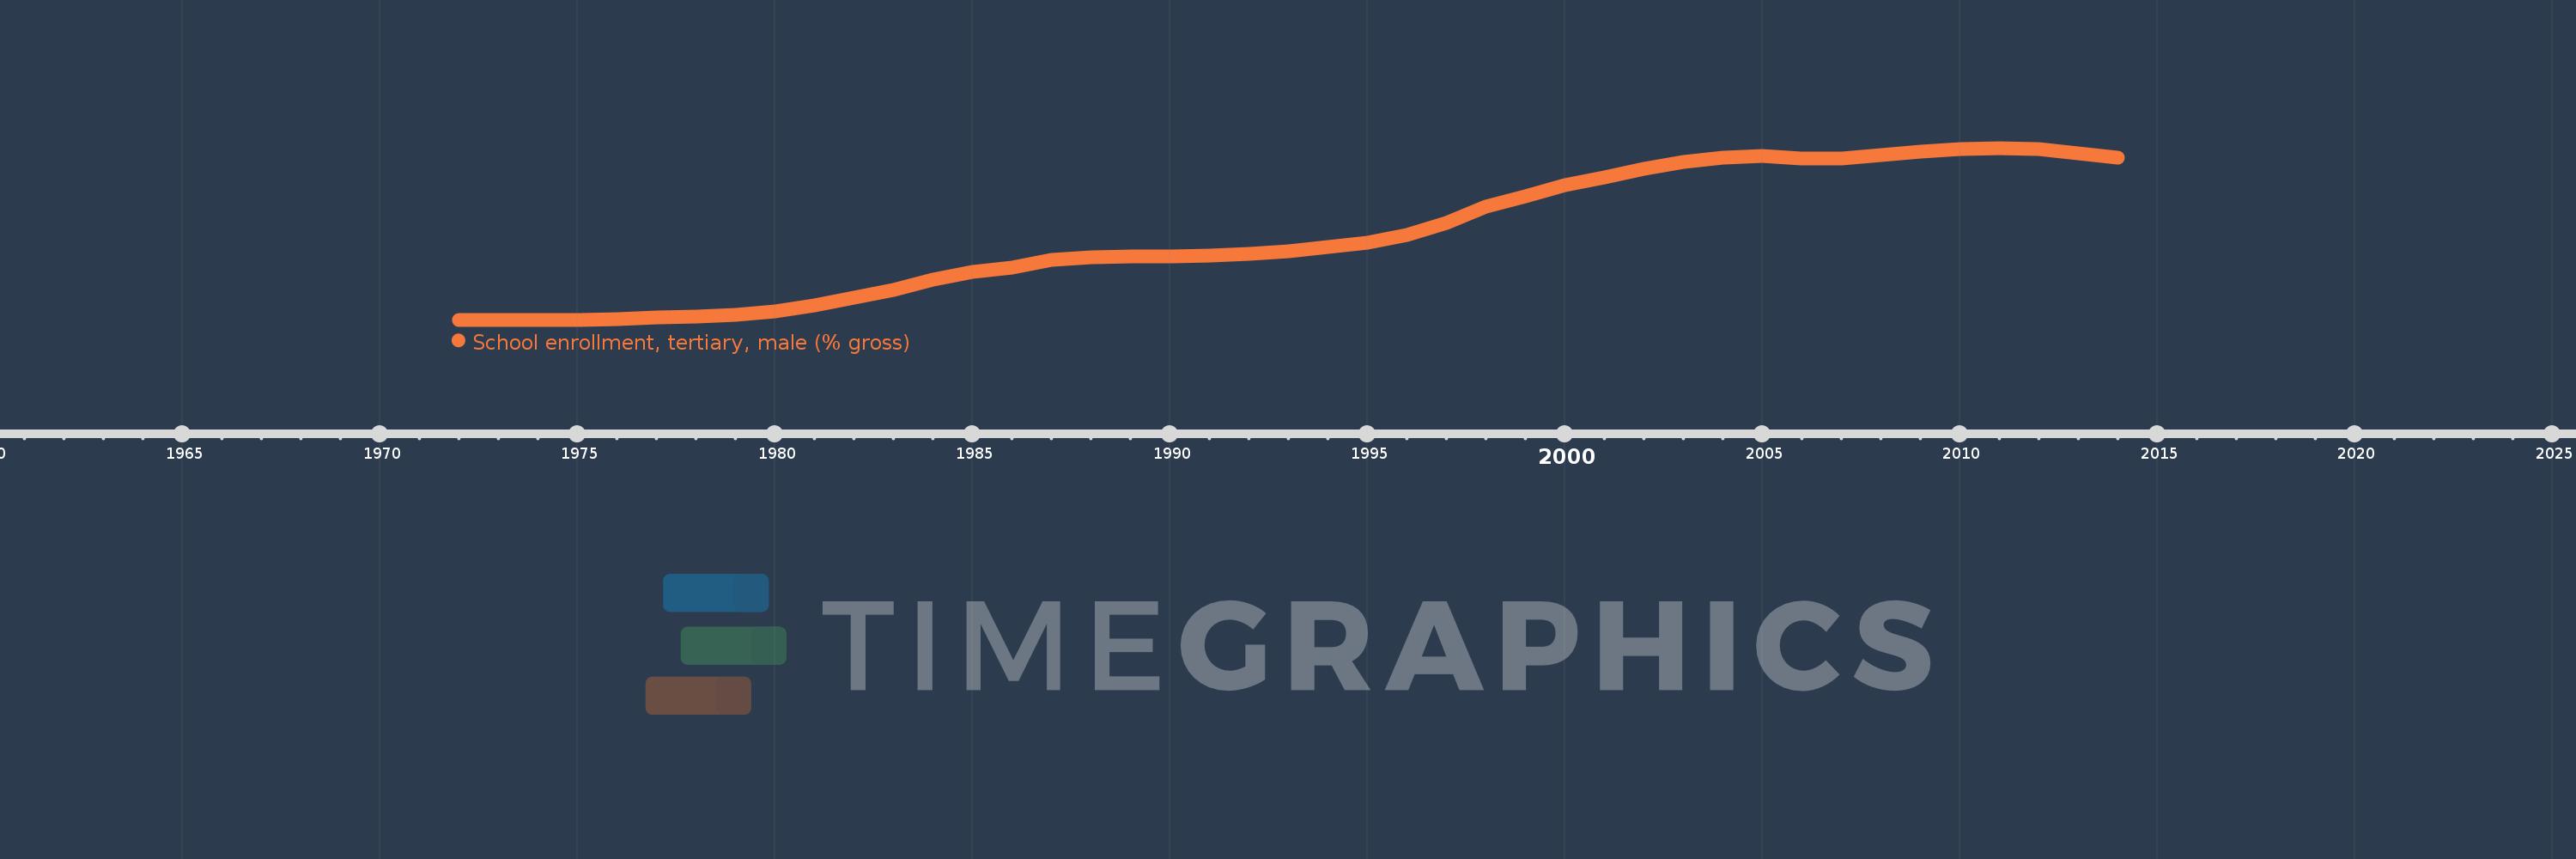
School enrollment, tertiary, male (% gross)
2014,2013,2012,2011,2010,2009,2008,2007,2006,2005,2004,2003,2002,2001,2000,1999,1998,1997,1996,1995,1994,1993,1992,1991,1990,1989,1988,1987,1986,1985,1984,1983,1981,1980,1979,1978,1977,1976,1975,1974,1973,1972
This statistics in other country:
AfghanistanAlbaniaAlgeriaAngolaAntigua and BarbudaArab WorldArgentinaArmeniaArubaAustraliaAustriaAzerbaijanBahamas, TheBahrainBangladeshBarbadosBelarusBelgiumBelizeBeninBermudaBhutanBoliviaBosnia and HerzegovinaBotswanaBrazilBrunei DarussalamBulgariaBurkina FasoBurundiCabo VerdeCambodiaCameroonCanadaCaribbean small statesCentral African RepublicCentral Europe and the BalticsChadChileChinaColombiaComorosCongo, Dem. Rep.Congo, Rep.Costa RicaCote d'IvoireCroatiaCubaCuracaoCyprusCzech RepublicDenmarkDjiboutiDominicaDominican RepublicEarly-demographic dividendEast Asia & PacificEast Asia & Pacific (excluding high income)East Asia & Pacific (IDA & IBRD countries)EcuadorEgypt, Arab Rep.El SalvadorEquatorial GuineaEritreaEstoniaEthiopiaEuro areaEurope & Central AsiaEurope & Central Asia (excluding high income)Europe & Central Asia (IDA & IBRD countries)European UnionFijiFinlandFragile and conflict affected situationsFranceGabonGambia, TheGeorgiaGermanyGhanaGreeceGrenadaGuatemalaGuineaGuinea-BissauGuyanaHaitiHeavily indebted poor countries (HIPC)High incomeHondurasHong Kong SAR, ChinaHungaryIBRD onlyIcelandIDA & IBRD totalIDA blendIDA onlyIDA totalIndiaIndonesiaIran, Islamic Rep.IraqIrelandIsraelItalyJamaicaJapanJordanKazakhstanKenyaKorea, Dem. People’s Rep.Korea, Rep.KuwaitKyrgyz RepublicLao PDRLate-demographic dividendLatin America & Caribbean Latin America & Caribbean (excluding high income)Latin America & the Caribbean (IDA & IBRD countries)LatviaLeast developed countries: UN classificationLebanonLesothoLiberiaLibyaLiechtensteinLithuaniaLow & middle incomeLow incomeLower middle incomeLuxembourgMacao SAR, ChinaMacedonia, FYRMadagascarMalawiMaldivesMaliMaltaMarshall IslandsMauritaniaMauritiusMexicoMicronesia, Fed. Sts.Middle East & North AfricaMiddle East & North Africa (excluding high income)Middle East & North Africa (IDA & IBRD countries)Middle incomeMoldovaMongoliaMontenegroMoroccoMozambiqueMyanmarNamibiaNepalNetherlandsNew ZealandNicaraguaNigerNigeriaNorth AmericaNorwayOECD membersOmanOther small statesPacific island small statesPakistanPalauPanamaPapua New GuineaParaguayPeruPhilippinesPolandPortugalPost-demographic dividendPre-demographic dividendPuerto RicoQatarRomaniaRussian FederationRwandaSamoaSan MarinoSao Tome and PrincipeSaudi ArabiaSenegalSerbiaSeychellesSierra LeoneSingaporeSlovak RepublicSloveniaSmall statesSomaliaSouth AfricaSouth AsiaSouth Asia (IDA & IBRD)SpainSri LankaSt. Kitts and NevisSt. LuciaSt. Vincent and the GrenadinesSub-Saharan Africa Sub-Saharan Africa (excluding high income)Sub-Saharan Africa (IDA & IBRD countries)SudanSurinameSwazilandSwedenSwitzerlandSyrian Arab RepublicTajikistanTanzaniaThailandTimor-LesteTogoTongaTrinidad and TobagoTunisiaTurkeyTurkmenistanUgandaUkraineUnited Arab EmiratesUnited KingdomUnited StatesUpper middle incomeUruguayUzbekistanVanuatuVenezuela, RBVietnamWest Bank and GazaWorldYemen, Rep.ZambiaZimbabwe Timeline:
This timeline shows a graph from 1972 to 2014 of Korea, Rep.. No data until 1971. Number of actual observations by date: 42.
Source name:
World Development Indicators
Source organization:
United Nations Educational, Scientific, and Cultural Organization (UNESCO) Institute for Statistics.
Categories, topics:
Education, Gender
Last updated:
apr 23, 2017
Indicators value changes by year
Maximum:
113.546
jan 1, 2011
At the date of observation
Value
Absolute change
Change from previous value
jan 1, 1972
10.849
+10.849
0.0%
jan 1, 1973
10.933
+0.084
0.77%
jan 1, 1974
10.84
-0.092
-0.84%
jan 1, 1975
10.883
+0.042
0.39%
jan 1, 1976
11.041
+0.158
1.45%
jan 1, 1977
12.424
+1.384
12.53%
jan 1, 1978
12.873
+0.448
3.61%
jan 1, 1979
13.989
+1.116
8.67%
jan 1, 1980
15.849
+1.86
13.3%
jan 1, 1981
19.26
+3.411
21.52%
jan 1, 1983
28.436
+9.176
47.65%
jan 1, 1984
34.777
+6.341
22.3%
jan 1, 1985
39.396
+4.619
13.28%
jan 1, 1986
42.145
+2.749
6.98%
jan 1, 1987
46.429
+4.284
10.16%
jan 1, 1988
48.017
+1.588
3.42%
jan 1, 1989
48.55
+0.533
1.11%
jan 1, 1990
48.516
-0.034
-0.07%
jan 1, 1991
49.348
+0.833
1.72%
jan 1, 1992
50.394
+1.045
2.12%
jan 1, 1993
51.649
+1.256
2.49%
jan 1, 1994
54.386
+2.737
5.3%
jan 1, 1995
56.938
+2.552
4.69%
jan 1, 1996
61.455
+4.516
7.93%
jan 1, 1997
68.815
+7.361
11.98%
jan 1, 1998
78.295
+9.48
13.78%
jan 1, 1999
84.614
+6.318
8.07%
jan 1, 2000
91.153
+6.539
7.73%
jan 1, 2001
95.968
+4.815
5.28%
jan 1, 2002
100.961
+4.994
5.2%
jan 1, 2003
105.356
+4.395
4.35%
jan 1, 2004
107.999
+2.642
2.51%
jan 1, 2005
109.012
+1.013
0.94%
jan 1, 2006
107.426
-1.586
-1.45%
jan 1, 2007
107.47
+0.044
0.04%
jan 1, 2008
109.263
+1.794
1.67%
jan 1, 2009
111.253
+1.99
1.82%
jan 1, 2010
113.122
+1.869
1.68%
jan 1, 2011
113.546
+0.424
0.37%
jan 1, 2012
112.993
-0.553
-0.49%
jan 1, 2013
110.072
-2.921
-2.59%
jan 1, 2014
107.837
-2.235
-2.03%
Ranking of countries by current statistics by years


Comments: