29
/
en
AIzaSyAYiBZKx7MnpbEhh9jyipgxe19OcubqV5w
April 1, 2024
268689
Tunisia
TUN
true
2
1
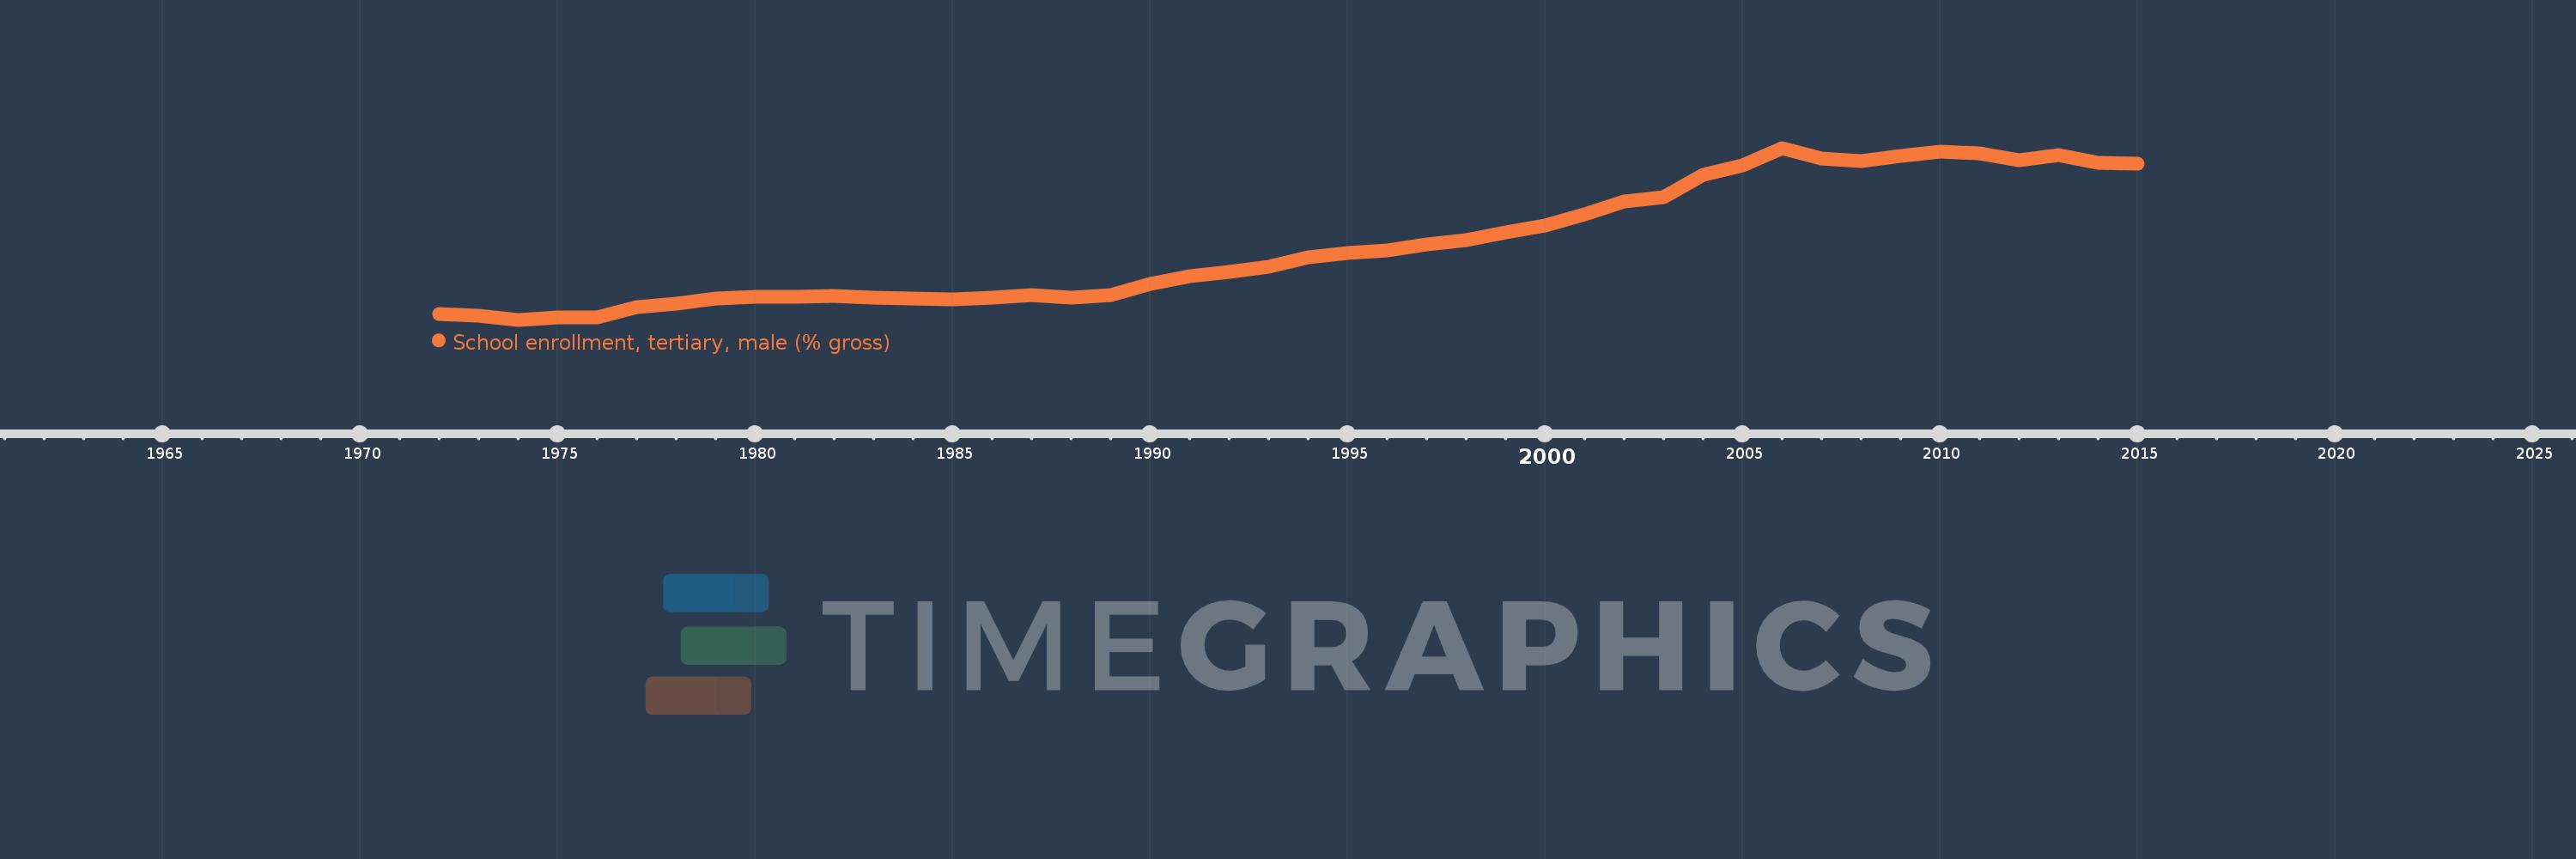
School enrollment, tertiary, male (% gross)
2015,2014,2013,2012,2011,2010,2009,2008,2007,2006,2005,2004,2003,2002,2001,2000,1999,1998,1997,1996,1995,1994,1993,1992,1991,1990,1989,1988,1987,1986,1985,1984,1983,1982,1981,1980,1979,1978,1977,1976,1975,1974,1973,1972
This statistics in other country:
AfghanistanAlbaniaAlgeriaAngolaAntigua and BarbudaArab WorldArgentinaArmeniaArubaAustraliaAustriaAzerbaijanBahamas, TheBahrainBangladeshBarbadosBelarusBelgiumBelizeBeninBermudaBhutanBoliviaBosnia and HerzegovinaBotswanaBrazilBrunei DarussalamBulgariaBurkina FasoBurundiCabo VerdeCambodiaCameroonCanadaCaribbean small statesCentral African RepublicCentral Europe and the BalticsChadChileChinaColombiaComorosCongo, Dem. Rep.Congo, Rep.Costa RicaCote d'IvoireCroatiaCubaCuracaoCyprusCzech RepublicDenmarkDjiboutiDominicaDominican RepublicEarly-demographic dividendEast Asia & PacificEast Asia & Pacific (excluding high income)East Asia & Pacific (IDA & IBRD countries)EcuadorEgypt, Arab Rep.El SalvadorEquatorial GuineaEritreaEstoniaEthiopiaEuro areaEurope & Central AsiaEurope & Central Asia (excluding high income)Europe & Central Asia (IDA & IBRD countries)European UnionFijiFinlandFragile and conflict affected situationsFranceGabonGambia, TheGeorgiaGermanyGhanaGreeceGrenadaGuatemalaGuineaGuinea-BissauGuyanaHaitiHeavily indebted poor countries (HIPC)High incomeHondurasHong Kong SAR, ChinaHungaryIBRD onlyIcelandIDA & IBRD totalIDA blendIDA onlyIDA totalIndiaIndonesiaIran, Islamic Rep.IraqIrelandIsraelItalyJamaicaJapanJordanKazakhstanKenyaKorea, Dem. People’s Rep.Korea, Rep.KuwaitKyrgyz RepublicLao PDRLate-demographic dividendLatin America & Caribbean Latin America & Caribbean (excluding high income)Latin America & the Caribbean (IDA & IBRD countries)LatviaLeast developed countries: UN classificationLebanonLesothoLiberiaLibyaLiechtensteinLithuaniaLow & middle incomeLow incomeLower middle incomeLuxembourgMacao SAR, ChinaMacedonia, FYRMadagascarMalawiMaldivesMaliMaltaMarshall IslandsMauritaniaMauritiusMexicoMicronesia, Fed. Sts.Middle East & North AfricaMiddle East & North Africa (excluding high income)Middle East & North Africa (IDA & IBRD countries)Middle incomeMoldovaMongoliaMontenegroMoroccoMozambiqueMyanmarNamibiaNepalNetherlandsNew ZealandNicaraguaNigerNigeriaNorth AmericaNorwayOECD membersOmanOther small statesPacific island small statesPakistanPalauPanamaPapua New GuineaParaguayPeruPhilippinesPolandPortugalPost-demographic dividendPre-demographic dividendPuerto RicoQatarRomaniaRussian FederationRwandaSamoaSan MarinoSao Tome and PrincipeSaudi ArabiaSenegalSerbiaSeychellesSierra LeoneSingaporeSlovak RepublicSloveniaSmall statesSomaliaSouth AfricaSouth AsiaSouth Asia (IDA & IBRD)SpainSri LankaSt. Kitts and NevisSt. LuciaSt. Vincent and the GrenadinesSub-Saharan Africa Sub-Saharan Africa (excluding high income)Sub-Saharan Africa (IDA & IBRD countries)SudanSurinameSwazilandSwedenSwitzerlandSyrian Arab RepublicTajikistanTanzaniaThailandTimor-LesteTogoTongaTrinidad and TobagoTunisiaTurkeyTurkmenistanUgandaUkraineUnited Arab EmiratesUnited KingdomUnited StatesUpper middle incomeUruguayUzbekistanVanuatuVenezuela, RBVietnamWest Bank and GazaWorldYemen, Rep.ZambiaZimbabwe Timeline:
This timeline shows a graph from 1972 to 2015 of Tunisia. No data until 1971. Number of actual observations by date: 44.
Source name:
World Development Indicators
Source organization:
United Nations Educational, Scientific, and Cultural Organization (UNESCO) Institute for Statistics.
Categories, topics:
Education, Gender
Last updated:
apr 23, 2017
Indicators value changes by year
Maximum:
28.576
jan 1, 2006
At the date of observation
Value
Absolute change
Change from previous value
jan 1, 1972
4.507
+4.507
0.0%
jan 1, 1973
4.206
-0.302
-6.69%
jan 1, 1974
3.628
-0.578
-13.73%
jan 1, 1975
3.943
+0.315
8.67%
jan 1, 1976
3.978
+0.036
0.9%
jan 1, 1977
5.468
+1.489
37.44%
jan 1, 1978
5.925
+0.457
8.36%
jan 1, 1979
6.676
+0.751
12.68%
jan 1, 1980
6.925
+0.25
3.74%
jan 1, 1981
6.913
-0.013
-0.18%
jan 1, 1982
7.069
+0.157
2.27%
jan 1, 1983
6.894
-0.175
-2.48%
jan 1, 1984
6.735
-0.159
-2.31%
jan 1, 1985
6.6
-0.135
-2.0%
jan 1, 1986
6.864
+0.264
4.0%
jan 1, 1987
7.205
+0.341
4.97%
jan 1, 1988
6.833
-0.372
-5.17%
jan 1, 1989
7.187
+0.354
5.18%
jan 1, 1990
8.801
+1.614
22.46%
jan 1, 1991
9.984
+1.183
13.44%
jan 1, 1992
10.616
+0.633
6.34%
jan 1, 1993
11.34
+0.724
6.82%
jan 1, 1994
12.671
+1.331
11.74%
jan 1, 1995
13.331
+0.66
5.21%
jan 1, 1996
13.73
+0.399
2.99%
jan 1, 1997
14.553
+0.823
6.0%
jan 1, 1998
15.156
+0.603
4.14%
jan 1, 1999
16.29
+1.133
7.48%
jan 1, 2000
17.283
+0.994
6.1%
jan 1, 2001
18.921
+1.638
9.48%
jan 1, 2002
20.771
+1.85
9.78%
jan 1, 2003
21.464
+0.693
3.33%
jan 1, 2004
24.704
+3.24
15.1%
jan 1, 2005
26.063
+1.359
5.5%
jan 1, 2006
28.576
+2.513
9.64%
jan 1, 2007
27.096
-1.479
-5.18%
jan 1, 2008
26.677
-0.419
-1.55%
jan 1, 2009
27.478
+0.801
3.0%
jan 1, 2010
28.042
+0.564
2.05%
jan 1, 2011
27.829
-0.213
-0.76%
jan 1, 2012
26.746
-1.083
-3.89%
jan 1, 2013
27.571
+0.825
3.08%
jan 1, 2014
26.429
-1.142
-4.14%
jan 1, 2015
26.285
-0.144
-0.54%
Ranking of countries by current statistics by years


Comments: