29
/
en
AIzaSyAYiBZKx7MnpbEhh9jyipgxe19OcubqV5w
April 1, 2024
276151
United Kingdom
GBR
true
2
1
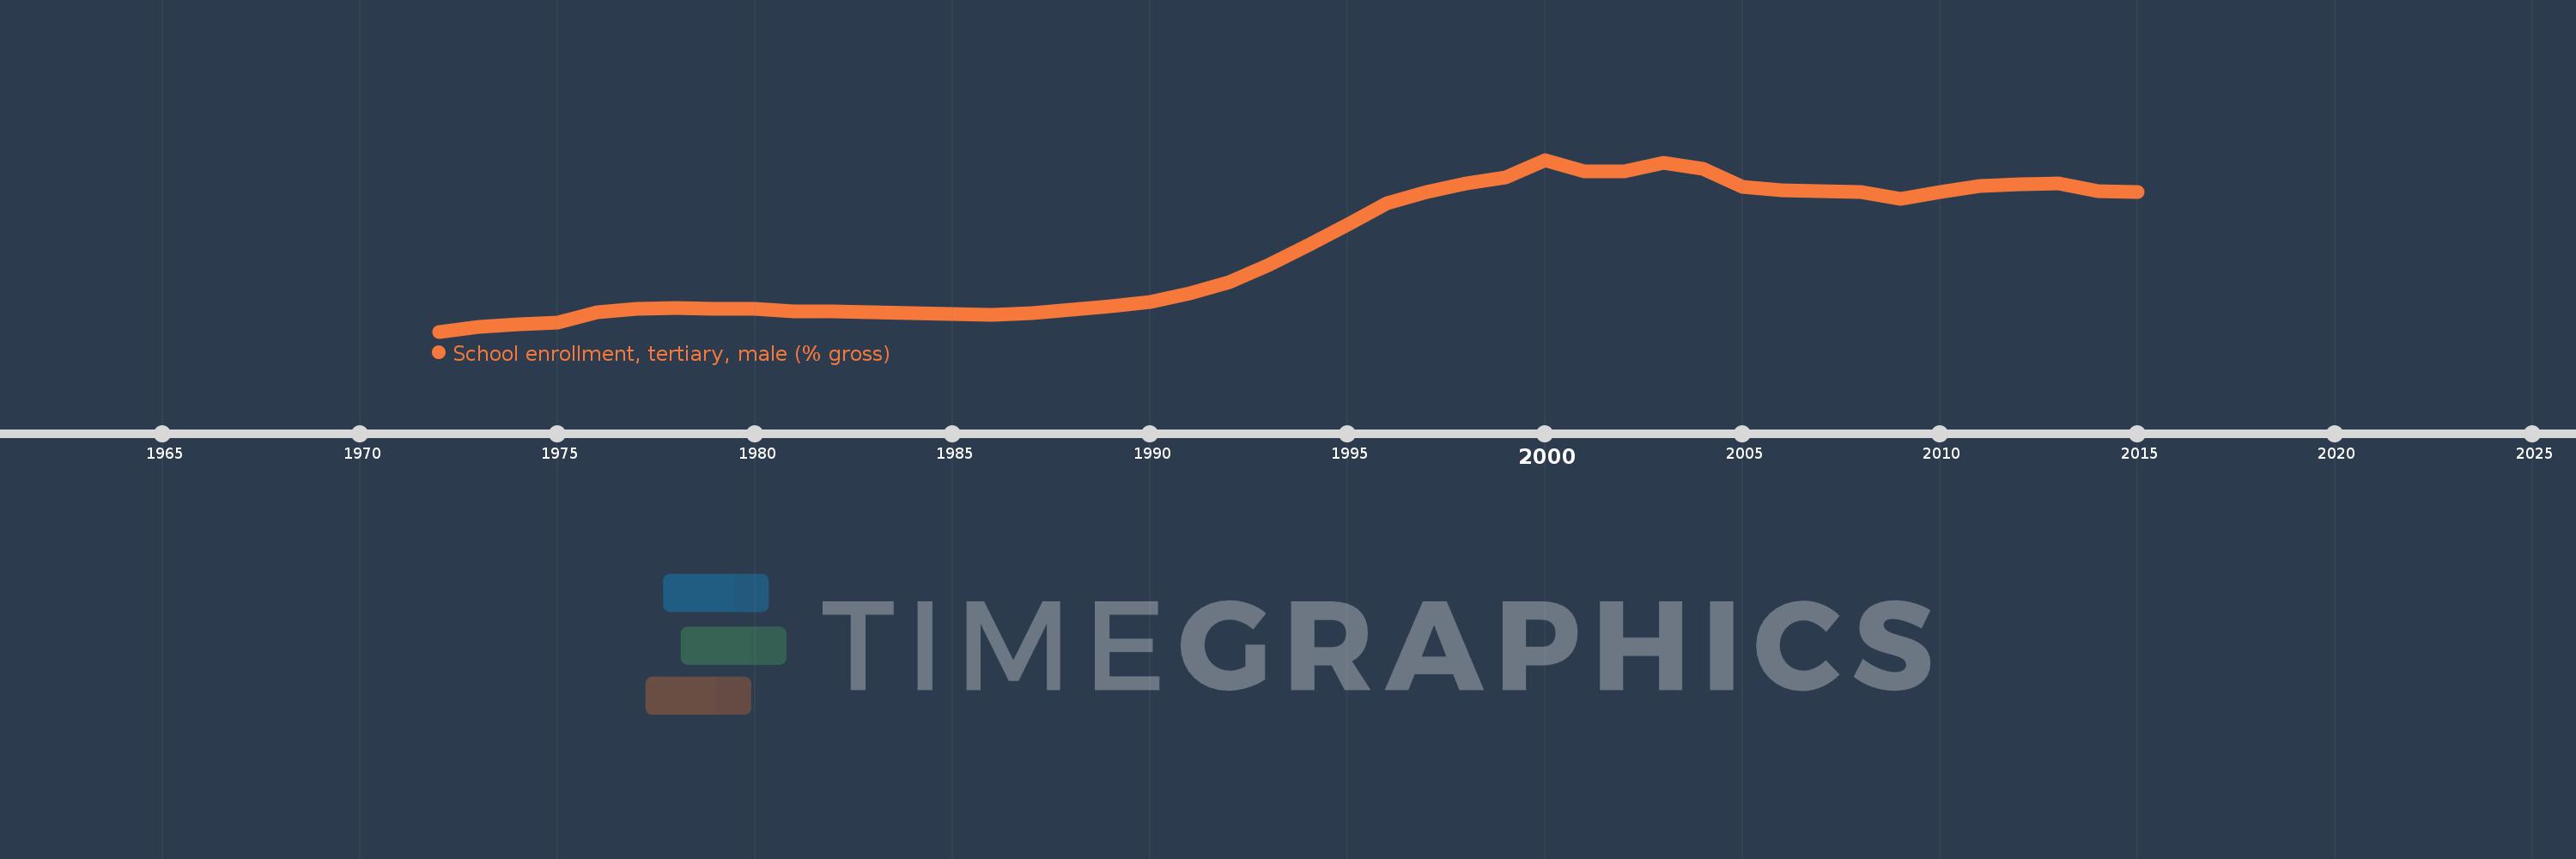
School enrollment, tertiary, male (% gross)
2015,2014,2013,2012,2011,2010,2009,2008,2007,2006,2005,2004,2003,2002,2001,2000,1999,1998,1997,1996,1995,1994,1993,1992,1991,1990,1989,1988,1987,1986,1985,1984,1983,1982,1981,1980,1979,1978,1977,1976,1975,1974,1973,1972
This statistics in other country:
AfghanistanAlbaniaAlgeriaAngolaAntigua and BarbudaArab WorldArgentinaArmeniaArubaAustraliaAustriaAzerbaijanBahamas, TheBahrainBangladeshBarbadosBelarusBelgiumBelizeBeninBermudaBhutanBoliviaBosnia and HerzegovinaBotswanaBrazilBrunei DarussalamBulgariaBurkina FasoBurundiCabo VerdeCambodiaCameroonCanadaCaribbean small statesCentral African RepublicCentral Europe and the BalticsChadChileChinaColombiaComorosCongo, Dem. Rep.Congo, Rep.Costa RicaCote d'IvoireCroatiaCubaCuracaoCyprusCzech RepublicDenmarkDjiboutiDominicaDominican RepublicEarly-demographic dividendEast Asia & PacificEast Asia & Pacific (excluding high income)East Asia & Pacific (IDA & IBRD countries)EcuadorEgypt, Arab Rep.El SalvadorEquatorial GuineaEritreaEstoniaEthiopiaEuro areaEurope & Central AsiaEurope & Central Asia (excluding high income)Europe & Central Asia (IDA & IBRD countries)European UnionFijiFinlandFragile and conflict affected situationsFranceGabonGambia, TheGeorgiaGermanyGhanaGreeceGrenadaGuatemalaGuineaGuinea-BissauGuyanaHaitiHeavily indebted poor countries (HIPC)High incomeHondurasHong Kong SAR, ChinaHungaryIBRD onlyIcelandIDA & IBRD totalIDA blendIDA onlyIDA totalIndiaIndonesiaIran, Islamic Rep.IraqIrelandIsraelItalyJamaicaJapanJordanKazakhstanKenyaKorea, Dem. People’s Rep.Korea, Rep.KuwaitKyrgyz RepublicLao PDRLate-demographic dividendLatin America & Caribbean Latin America & Caribbean (excluding high income)Latin America & the Caribbean (IDA & IBRD countries)LatviaLeast developed countries: UN classificationLebanonLesothoLiberiaLibyaLiechtensteinLithuaniaLow & middle incomeLow incomeLower middle incomeLuxembourgMacao SAR, ChinaMacedonia, FYRMadagascarMalawiMaldivesMaliMaltaMarshall IslandsMauritaniaMauritiusMexicoMicronesia, Fed. Sts.Middle East & North AfricaMiddle East & North Africa (excluding high income)Middle East & North Africa (IDA & IBRD countries)Middle incomeMoldovaMongoliaMontenegroMoroccoMozambiqueMyanmarNamibiaNepalNetherlandsNew ZealandNicaraguaNigerNigeriaNorth AmericaNorwayOECD membersOmanOther small statesPacific island small statesPakistanPalauPanamaPapua New GuineaParaguayPeruPhilippinesPolandPortugalPost-demographic dividendPre-demographic dividendPuerto RicoQatarRomaniaRussian FederationRwandaSamoaSan MarinoSao Tome and PrincipeSaudi ArabiaSenegalSerbiaSeychellesSierra LeoneSingaporeSlovak RepublicSloveniaSmall statesSomaliaSouth AfricaSouth AsiaSouth Asia (IDA & IBRD)SpainSri LankaSt. Kitts and NevisSt. LuciaSt. Vincent and the GrenadinesSub-Saharan Africa Sub-Saharan Africa (excluding high income)Sub-Saharan Africa (IDA & IBRD countries)SudanSurinameSwazilandSwedenSwitzerlandSyrian Arab RepublicTajikistanTanzaniaThailandTimor-LesteTogoTongaTrinidad and TobagoTunisiaTurkeyTurkmenistanUgandaUkraineUnited Arab EmiratesUnited KingdomUnited StatesUpper middle incomeUruguayUzbekistanVanuatuVenezuela, RBVietnamWest Bank and GazaWorldYemen, Rep.ZambiaZimbabwe Timeline:
This timeline shows a graph from 1972 to 2015 of United Kingdom. No data until 1971. Number of actual observations by date: 44.
Source name:
World Development Indicators
Source organization:
United Nations Educational, Scientific, and Cultural Organization (UNESCO) Institute for Statistics.
Categories, topics:
Education, Gender
Last updated:
apr 23, 2017
Indicators value changes by year
Maximum:
56.023
jan 1, 2000
At the date of observation
Value
Absolute change
Change from previous value
jan 1, 1972
19.23
+19.23
0.0%
jan 1, 1973
20.195
+0.964
5.01%
jan 1, 1974
20.719
+0.525
2.6%
jan 1, 1975
21.226
+0.507
2.45%
jan 1, 1976
23.369
+2.143
10.1%
jan 1, 1977
24.11
+0.741
3.17%
jan 1, 1978
24.325
+0.214
0.89%
jan 1, 1979
24.134
-0.191
-0.79%
jan 1, 1980
24.137
+0.004
0.01%
jan 1, 1981
23.474
-0.663
-2.75%
jan 1, 1982
23.479
+0.005
0.02%
jan 1, 1983
23.349
-0.13
-0.56%
jan 1, 1984
23.156
-0.192
-0.82%
jan 1, 1985
23.065
-0.091
-0.39%
jan 1, 1986
22.847
-0.218
-0.94%
jan 1, 1987
23.119
+0.272
1.19%
jan 1, 1988
23.931
+0.812
3.51%
jan 1, 1989
24.618
+0.687
2.87%
jan 1, 1990
25.646
+1.028
4.18%
jan 1, 1991
27.375
+1.729
6.74%
jan 1, 1992
29.781
+2.406
8.79%
jan 1, 1993
33.569
+3.788
12.72%
jan 1, 1994
37.759
+4.19
12.48%
jan 1, 1995
42.207
+4.447
11.78%
jan 1, 1996
46.775
+4.568
10.82%
jan 1, 1997
49.084
+2.31
4.94%
jan 1, 1998
50.97
+1.885
3.84%
jan 1, 1999
52.286
+1.316
2.58%
jan 1, 2000
56.023
+3.737
7.15%
jan 1, 2001
53.622
-2.401
-4.29%
jan 1, 2002
53.545
-0.077
-0.14%
jan 1, 2003
55.463
+1.919
3.58%
jan 1, 2004
54.015
-1.448
-2.61%
jan 1, 2005
50.158
-3.857
-7.14%
jan 1, 2006
49.532
-0.626
-1.25%
jan 1, 2007
49.346
-0.186
-0.38%
jan 1, 2008
49.083
-0.263
-0.53%
jan 1, 2009
47.645
-1.438
-2.93%
jan 1, 2010
49.058
+1.412
2.96%
jan 1, 2011
50.387
+1.329
2.71%
jan 1, 2012
50.69
+0.303
0.6%
jan 1, 2013
51.043
+0.353
0.7%
jan 1, 2014
49.264
-1.779
-3.49%
jan 1, 2015
49.045
-0.219
-0.44%
Ranking of countries by current statistics by years


Comments: