29
/
en
AIzaSyAYiBZKx7MnpbEhh9jyipgxe19OcubqV5w
April 1, 2024
47714
Lower middle income
LMC
false
2
1
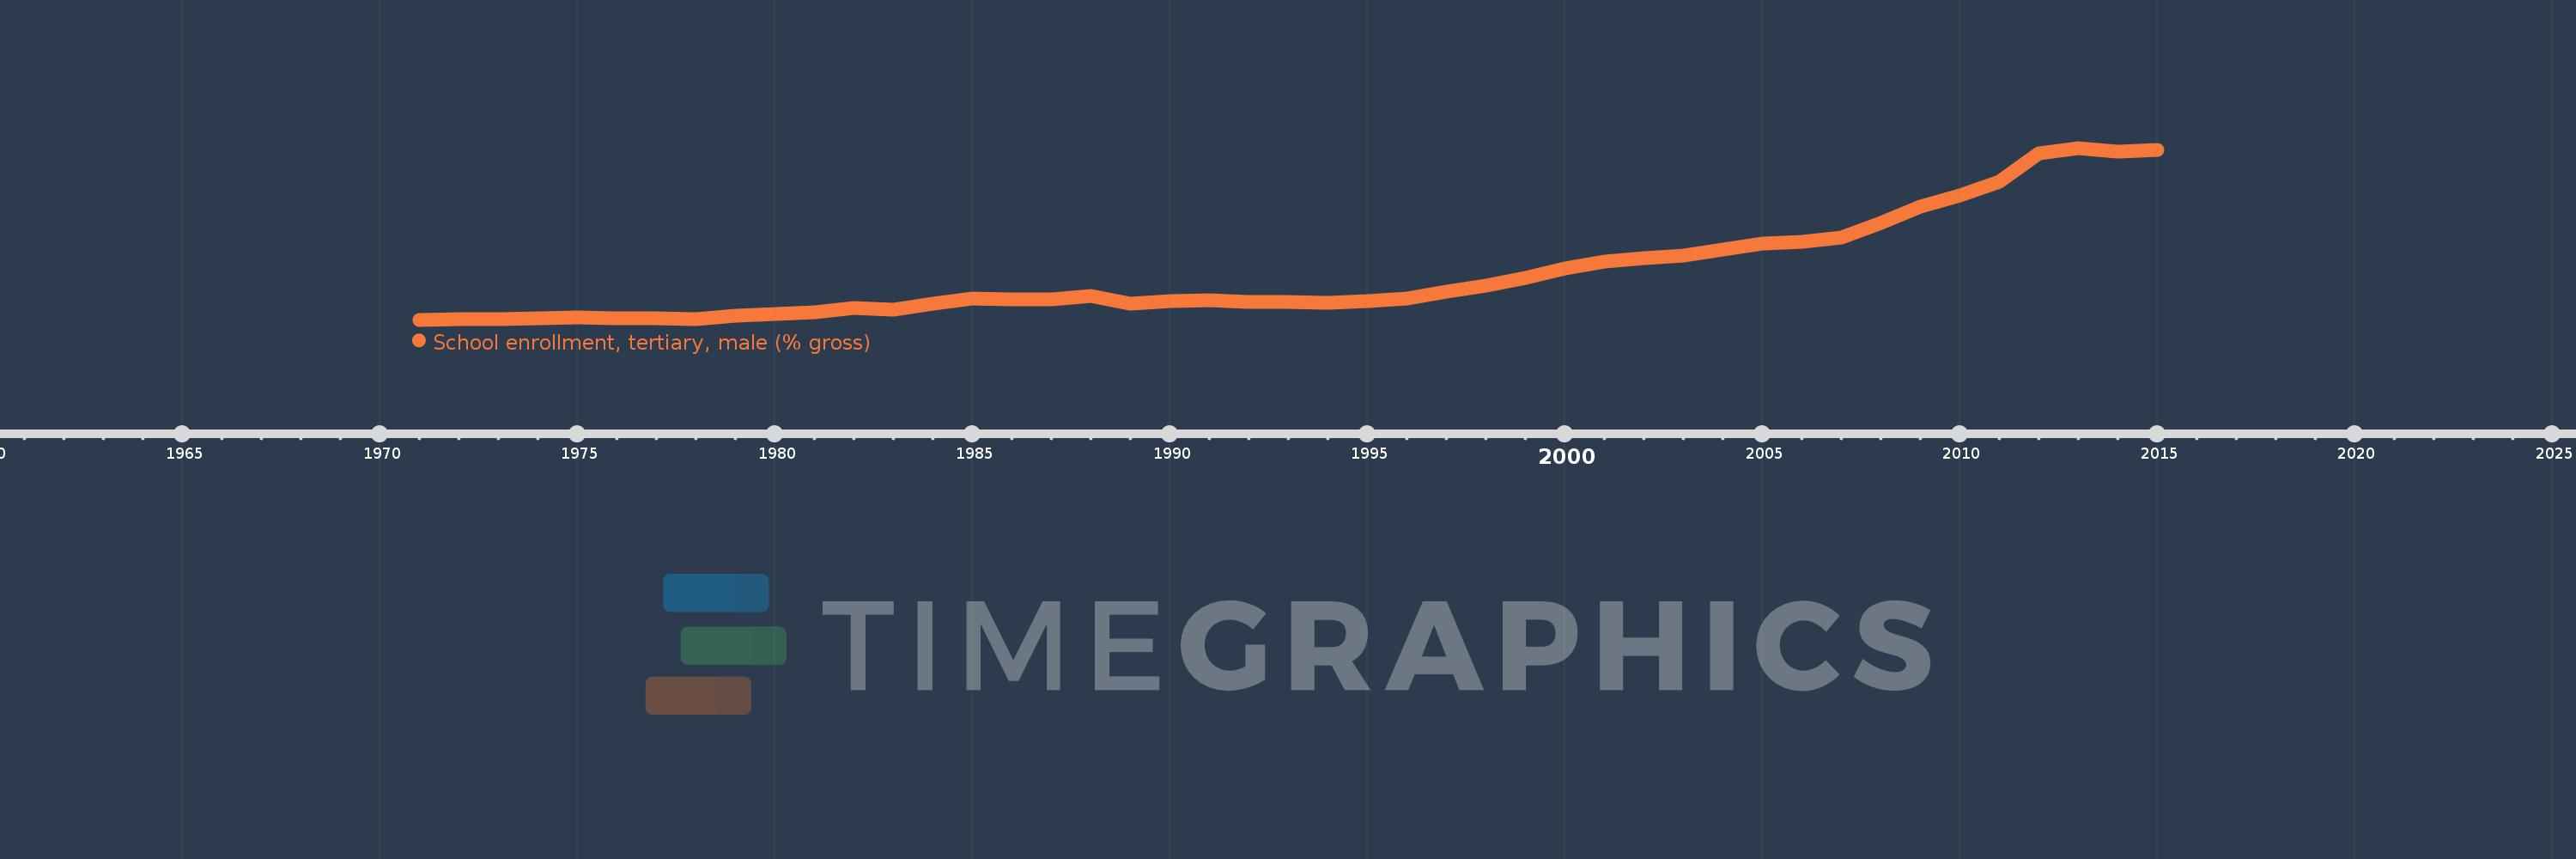
School enrollment, tertiary, male (% gross)
2015,2014,2013,2012,2011,2010,2009,2008,2007,2006,2005,2004,2003,2002,2001,2000,1999,1998,1997,1996,1995,1994,1993,1992,1991,1990,1989,1988,1987,1986,1985,1984,1983,1982,1981,1980,1979,1978,1977,1976,1975,1974,1973,1972,1971
This statistics in other country:
AfghanistanAlbaniaAlgeriaAngolaAntigua and BarbudaArab WorldArgentinaArmeniaArubaAustraliaAustriaAzerbaijanBahamas, TheBahrainBangladeshBarbadosBelarusBelgiumBelizeBeninBermudaBhutanBoliviaBosnia and HerzegovinaBotswanaBrazilBrunei DarussalamBulgariaBurkina FasoBurundiCabo VerdeCambodiaCameroonCanadaCaribbean small statesCentral African RepublicCentral Europe and the BalticsChadChileChinaColombiaComorosCongo, Dem. Rep.Congo, Rep.Costa RicaCote d'IvoireCroatiaCubaCuracaoCyprusCzech RepublicDenmarkDjiboutiDominicaDominican RepublicEarly-demographic dividendEast Asia & PacificEast Asia & Pacific (excluding high income)East Asia & Pacific (IDA & IBRD countries)EcuadorEgypt, Arab Rep.El SalvadorEquatorial GuineaEritreaEstoniaEthiopiaEuro areaEurope & Central AsiaEurope & Central Asia (excluding high income)Europe & Central Asia (IDA & IBRD countries)European UnionFijiFinlandFragile and conflict affected situationsFranceGabonGambia, TheGeorgiaGermanyGhanaGreeceGrenadaGuatemalaGuineaGuinea-BissauGuyanaHaitiHeavily indebted poor countries (HIPC)High incomeHondurasHong Kong SAR, ChinaHungaryIBRD onlyIcelandIDA & IBRD totalIDA blendIDA onlyIDA totalIndiaIndonesiaIran, Islamic Rep.IraqIrelandIsraelItalyJamaicaJapanJordanKazakhstanKenyaKorea, Dem. People’s Rep.Korea, Rep.KuwaitKyrgyz RepublicLao PDRLate-demographic dividendLatin America & Caribbean Latin America & Caribbean (excluding high income)Latin America & the Caribbean (IDA & IBRD countries)LatviaLeast developed countries: UN classificationLebanonLesothoLiberiaLibyaLiechtensteinLithuaniaLow & middle incomeLow incomeLower middle incomeLuxembourgMacao SAR, ChinaMacedonia, FYRMadagascarMalawiMaldivesMaliMaltaMarshall IslandsMauritaniaMauritiusMexicoMicronesia, Fed. Sts.Middle East & North AfricaMiddle East & North Africa (excluding high income)Middle East & North Africa (IDA & IBRD countries)Middle incomeMoldovaMongoliaMontenegroMoroccoMozambiqueMyanmarNamibiaNepalNetherlandsNew ZealandNicaraguaNigerNigeriaNorth AmericaNorwayOECD membersOmanOther small statesPacific island small statesPakistanPalauPanamaPapua New GuineaParaguayPeruPhilippinesPolandPortugalPost-demographic dividendPre-demographic dividendPuerto RicoQatarRomaniaRussian FederationRwandaSamoaSan MarinoSao Tome and PrincipeSaudi ArabiaSenegalSerbiaSeychellesSierra LeoneSingaporeSlovak RepublicSloveniaSmall statesSomaliaSouth AfricaSouth AsiaSouth Asia (IDA & IBRD)SpainSri LankaSt. Kitts and NevisSt. LuciaSt. Vincent and the GrenadinesSub-Saharan Africa Sub-Saharan Africa (excluding high income)Sub-Saharan Africa (IDA & IBRD countries)SudanSurinameSwazilandSwedenSwitzerlandSyrian Arab RepublicTajikistanTanzaniaThailandTimor-LesteTogoTongaTrinidad and TobagoTunisiaTurkeyTurkmenistanUgandaUkraineUnited Arab EmiratesUnited KingdomUnited StatesUpper middle incomeUruguayUzbekistanVanuatuVenezuela, RBVietnamWest Bank and GazaWorldYemen, Rep.ZambiaZimbabwe Timeline:
This timeline shows a graph from 1971 to 2015 of Lower middle income. No data until 1970. Number of actual observations by date: 45.
Source name:
World Development Indicators
Source organization:
United Nations Educational, Scientific, and Cultural Organization (UNESCO) Institute for Statistics.
Categories, topics:
Education, Gender
Last updated:
apr 23, 2017
Indicators value changes by year
Maximum:
22.715
jan 1, 2013
At the date of observation
Value
Absolute change
Change from previous value
jan 1, 1971
7.421
+7.421
0.0%
jan 1, 1972
7.45
+0.029
0.39%
jan 1, 1973
7.506
+0.056
0.75%
jan 1, 1974
7.555
+0.049
0.65%
jan 1, 1975
7.596
+0.042
0.55%
jan 1, 1976
7.528
-0.068
-0.9%
jan 1, 1977
7.544
+0.016
0.21%
jan 1, 1978
7.509
-0.035
-0.46%
jan 1, 1979
7.762
+0.253
3.37%
jan 1, 1980
7.908
+0.146
1.88%
jan 1, 1981
8.095
+0.187
2.36%
jan 1, 1982
8.435
+0.34
4.2%
jan 1, 1983
8.28
-0.155
-1.84%
jan 1, 1984
8.824
+0.544
6.56%
jan 1, 1985
9.329
+0.505
5.72%
jan 1, 1986
9.255
-0.073
-0.79%
jan 1, 1987
9.253
-0.002
-0.03%
jan 1, 1988
9.561
+0.308
3.33%
jan 1, 1989
8.882
-0.679
-7.1%
jan 1, 1990
9.05
+0.168
1.89%
jan 1, 1991
9.137
+0.086
0.95%
jan 1, 1992
9.041
-0.095
-1.04%
jan 1, 1993
8.976
-0.066
-0.73%
jan 1, 1994
8.962
-0.014
-0.16%
jan 1, 1995
9.085
+0.123
1.38%
jan 1, 1996
9.284
+0.199
2.19%
jan 1, 1997
9.933
+0.649
6.99%
jan 1, 1998
10.478
+0.545
5.48%
jan 1, 1999
11.157
+0.679
6.48%
jan 1, 2000
11.971
+0.814
7.3%
jan 1, 2001
12.577
+0.606
5.06%
jan 1, 2002
12.891
+0.314
2.49%
jan 1, 2003
13.16
+0.269
2.08%
jan 1, 2004
13.635
+0.475
3.61%
jan 1, 2005
14.19
+0.555
4.07%
jan 1, 2006
14.328
+0.138
0.98%
jan 1, 2007
14.766
+0.438
3.06%
jan 1, 2008
16.036
+1.27
8.6%
jan 1, 2009
17.488
+1.452
9.05%
jan 1, 2010
18.453
+0.965
5.52%
jan 1, 2011
19.736
+1.283
6.95%
jan 1, 2012
22.248
+2.512
12.73%
jan 1, 2013
22.715
+0.468
2.1%
jan 1, 2014
22.366
-0.349
-1.54%
jan 1, 2015
22.519
+0.153
0.69%
Ranking of countries by current statistics by years


Comments: