29
/
en
AIzaSyAYiBZKx7MnpbEhh9jyipgxe19OcubqV5w
April 1, 2024
51480
Middle income
MIC
false
2
1
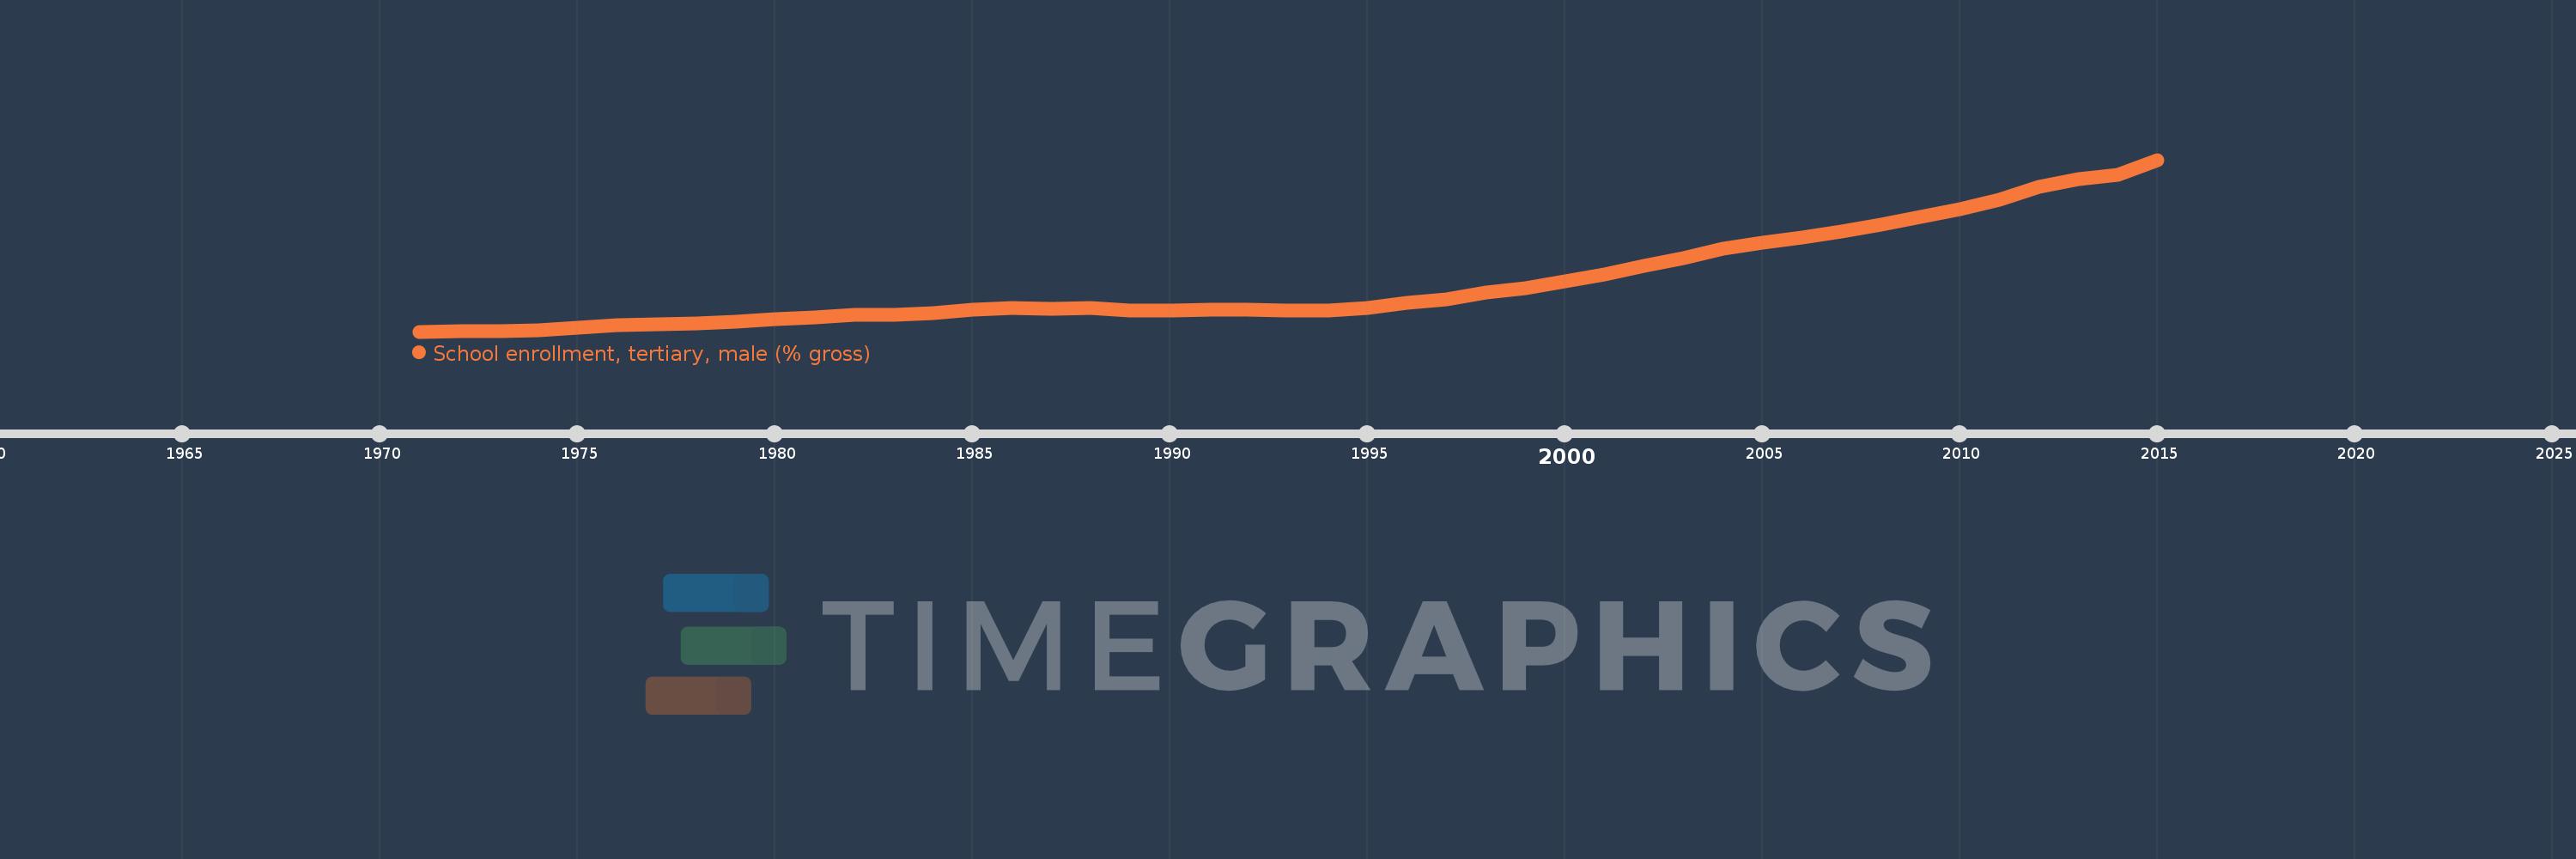
School enrollment, tertiary, male (% gross)
2015,2014,2013,2012,2011,2010,2009,2008,2007,2006,2005,2004,2003,2002,2001,2000,1999,1998,1997,1996,1995,1994,1993,1992,1991,1990,1989,1988,1987,1986,1985,1984,1983,1982,1981,1980,1979,1978,1977,1976,1975,1974,1973,1972,1971
This statistics in other country:
AfghanistanAlbaniaAlgeriaAngolaAntigua and BarbudaArab WorldArgentinaArmeniaArubaAustraliaAustriaAzerbaijanBahamas, TheBahrainBangladeshBarbadosBelarusBelgiumBelizeBeninBermudaBhutanBoliviaBosnia and HerzegovinaBotswanaBrazilBrunei DarussalamBulgariaBurkina FasoBurundiCabo VerdeCambodiaCameroonCanadaCaribbean small statesCentral African RepublicCentral Europe and the BalticsChadChileChinaColombiaComorosCongo, Dem. Rep.Congo, Rep.Costa RicaCote d'IvoireCroatiaCubaCuracaoCyprusCzech RepublicDenmarkDjiboutiDominicaDominican RepublicEarly-demographic dividendEast Asia & PacificEast Asia & Pacific (excluding high income)East Asia & Pacific (IDA & IBRD countries)EcuadorEgypt, Arab Rep.El SalvadorEquatorial GuineaEritreaEstoniaEthiopiaEuro areaEurope & Central AsiaEurope & Central Asia (excluding high income)Europe & Central Asia (IDA & IBRD countries)European UnionFijiFinlandFragile and conflict affected situationsFranceGabonGambia, TheGeorgiaGermanyGhanaGreeceGrenadaGuatemalaGuineaGuinea-BissauGuyanaHaitiHeavily indebted poor countries (HIPC)High incomeHondurasHong Kong SAR, ChinaHungaryIBRD onlyIcelandIDA & IBRD totalIDA blendIDA onlyIDA totalIndiaIndonesiaIran, Islamic Rep.IraqIrelandIsraelItalyJamaicaJapanJordanKazakhstanKenyaKorea, Dem. People’s Rep.Korea, Rep.KuwaitKyrgyz RepublicLao PDRLate-demographic dividendLatin America & Caribbean Latin America & Caribbean (excluding high income)Latin America & the Caribbean (IDA & IBRD countries)LatviaLeast developed countries: UN classificationLebanonLesothoLiberiaLibyaLiechtensteinLithuaniaLow & middle incomeLow incomeLower middle incomeLuxembourgMacao SAR, ChinaMacedonia, FYRMadagascarMalawiMaldivesMaliMaltaMarshall IslandsMauritaniaMauritiusMexicoMicronesia, Fed. Sts.Middle East & North AfricaMiddle East & North Africa (excluding high income)Middle East & North Africa (IDA & IBRD countries)Middle incomeMoldovaMongoliaMontenegroMoroccoMozambiqueMyanmarNamibiaNepalNetherlandsNew ZealandNicaraguaNigerNigeriaNorth AmericaNorwayOECD membersOmanOther small statesPacific island small statesPakistanPalauPanamaPapua New GuineaParaguayPeruPhilippinesPolandPortugalPost-demographic dividendPre-demographic dividendPuerto RicoQatarRomaniaRussian FederationRwandaSamoaSan MarinoSao Tome and PrincipeSaudi ArabiaSenegalSerbiaSeychellesSierra LeoneSingaporeSlovak RepublicSloveniaSmall statesSomaliaSouth AfricaSouth AsiaSouth Asia (IDA & IBRD)SpainSri LankaSt. Kitts and NevisSt. LuciaSt. Vincent and the GrenadinesSub-Saharan Africa Sub-Saharan Africa (excluding high income)Sub-Saharan Africa (IDA & IBRD countries)SudanSurinameSwazilandSwedenSwitzerlandSyrian Arab RepublicTajikistanTanzaniaThailandTimor-LesteTogoTongaTrinidad and TobagoTunisiaTurkeyTurkmenistanUgandaUkraineUnited Arab EmiratesUnited KingdomUnited StatesUpper middle incomeUruguayUzbekistanVanuatuVenezuela, RBVietnamWest Bank and GazaWorldYemen, Rep.ZambiaZimbabwe Timeline:
This timeline shows a graph from 1971 to 2015 of Middle income. No data until 1970. Number of actual observations by date: 45.
Source name:
World Development Indicators
Source organization:
United Nations Educational, Scientific, and Cultural Organization (UNESCO) Institute for Statistics.
Categories, topics:
Education, Gender
Last updated:
apr 23, 2017
Indicators value changes by year
Maximum:
30.294
jan 1, 2015
At the date of observation
Value
Absolute change
Change from previous value
jan 1, 1971
6.879
+6.879
0.0%
jan 1, 1972
6.892
+0.013
0.19%
jan 1, 1973
6.955
+0.063
0.92%
jan 1, 1974
7.111
+0.156
2.24%
jan 1, 1975
7.386
+0.275
3.86%
jan 1, 1976
7.71
+0.325
4.39%
jan 1, 1977
7.928
+0.218
2.82%
jan 1, 1978
8.024
+0.096
1.21%
jan 1, 1979
8.25
+0.226
2.82%
jan 1, 1980
8.575
+0.325
3.94%
jan 1, 1981
8.767
+0.192
2.24%
jan 1, 1982
9.126
+0.359
4.1%
jan 1, 1983
9.194
+0.068
0.74%
jan 1, 1984
9.441
+0.247
2.69%
jan 1, 1985
9.916
+0.475
5.03%
jan 1, 1986
10.055
+0.139
1.4%
jan 1, 1987
10.029
-0.026
-0.26%
jan 1, 1988
10.132
+0.103
1.03%
jan 1, 1989
9.77
-0.362
-3.57%
jan 1, 1990
9.779
+0.008
0.08%
jan 1, 1991
9.818
+0.039
0.4%
jan 1, 1992
9.812
-0.006
-0.06%
jan 1, 1993
9.727
-0.085
-0.87%
jan 1, 1994
9.734
+0.008
0.08%
jan 1, 1995
10.146
+0.412
4.23%
jan 1, 1996
10.744
+0.597
5.89%
jan 1, 1997
11.327
+0.584
5.43%
jan 1, 1998
12.153
+0.825
7.29%
jan 1, 1999
12.792
+0.639
5.26%
jan 1, 2000
13.767
+0.976
7.63%
jan 1, 2001
14.639
+0.872
6.33%
jan 1, 2002
15.798
+1.159
7.92%
jan 1, 2003
16.904
+1.107
7.01%
jan 1, 2004
18.178
+1.274
7.53%
jan 1, 2005
19.054
+0.876
4.82%
jan 1, 2006
19.714
+0.66
3.46%
jan 1, 2007
20.469
+0.754
3.83%
jan 1, 2008
21.437
+0.968
4.73%
jan 1, 2009
22.53
+1.093
5.1%
jan 1, 2010
23.564
+1.034
4.59%
jan 1, 2011
24.812
+1.247
5.29%
jan 1, 2012
26.617
+1.805
7.28%
jan 1, 2013
27.624
+1.007
3.78%
jan 1, 2014
28.283
+0.66
2.39%
jan 1, 2015
30.294
+2.011
7.11%
Ranking of countries by current statistics by years


Comments: