29
/
en
AIzaSyAYiBZKx7MnpbEhh9jyipgxe19OcubqV5w
April 1, 2024
107976
Colombia
COL
true
2
1
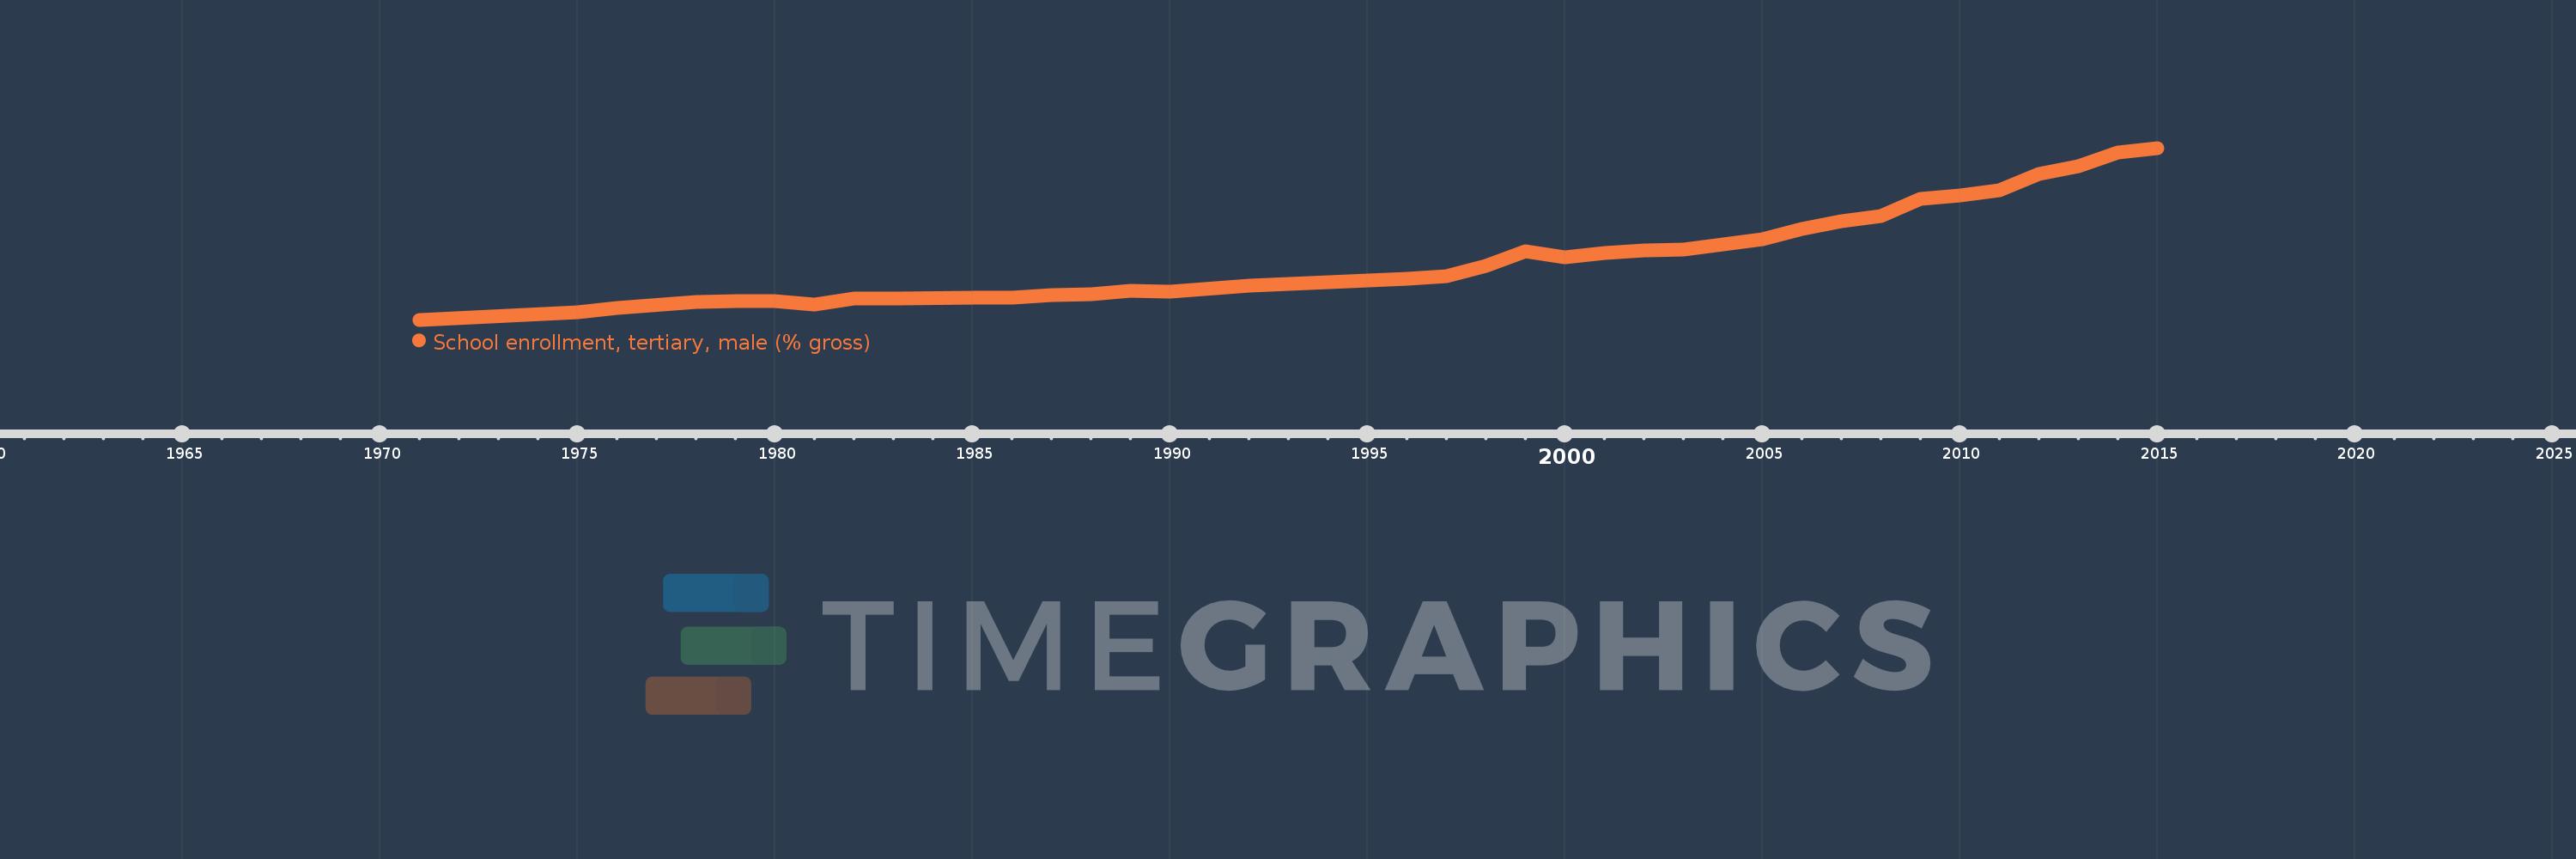
School enrollment, tertiary, male (% gross)
2015,2014,2013,2012,2011,2010,2009,2008,2007,2006,2005,2003,2002,2001,2000,1999,1998,1997,1996,1992,1990,1989,1988,1987,1986,1985,1983,1982,1981,1980,1979,1978,1976,1975,1971
This statistics in other country:
AfghanistanAlbaniaAlgeriaAngolaAntigua and BarbudaArab WorldArgentinaArmeniaArubaAustraliaAustriaAzerbaijanBahamas, TheBahrainBangladeshBarbadosBelarusBelgiumBelizeBeninBermudaBhutanBoliviaBosnia and HerzegovinaBotswanaBrazilBrunei DarussalamBulgariaBurkina FasoBurundiCabo VerdeCambodiaCameroonCanadaCaribbean small statesCentral African RepublicCentral Europe and the BalticsChadChileChinaColombiaComorosCongo, Dem. Rep.Congo, Rep.Costa RicaCote d'IvoireCroatiaCubaCuracaoCyprusCzech RepublicDenmarkDjiboutiDominicaDominican RepublicEarly-demographic dividendEast Asia & PacificEast Asia & Pacific (excluding high income)East Asia & Pacific (IDA & IBRD countries)EcuadorEgypt, Arab Rep.El SalvadorEquatorial GuineaEritreaEstoniaEthiopiaEuro areaEurope & Central AsiaEurope & Central Asia (excluding high income)Europe & Central Asia (IDA & IBRD countries)European UnionFijiFinlandFragile and conflict affected situationsFranceGabonGambia, TheGeorgiaGermanyGhanaGreeceGrenadaGuatemalaGuineaGuinea-BissauGuyanaHaitiHeavily indebted poor countries (HIPC)High incomeHondurasHong Kong SAR, ChinaHungaryIBRD onlyIcelandIDA & IBRD totalIDA blendIDA onlyIDA totalIndiaIndonesiaIran, Islamic Rep.IraqIrelandIsraelItalyJamaicaJapanJordanKazakhstanKenyaKorea, Dem. People’s Rep.Korea, Rep.KuwaitKyrgyz RepublicLao PDRLate-demographic dividendLatin America & Caribbean Latin America & Caribbean (excluding high income)Latin America & the Caribbean (IDA & IBRD countries)LatviaLeast developed countries: UN classificationLebanonLesothoLiberiaLibyaLiechtensteinLithuaniaLow & middle incomeLow incomeLower middle incomeLuxembourgMacao SAR, ChinaMacedonia, FYRMadagascarMalawiMaldivesMaliMaltaMarshall IslandsMauritaniaMauritiusMexicoMicronesia, Fed. Sts.Middle East & North AfricaMiddle East & North Africa (excluding high income)Middle East & North Africa (IDA & IBRD countries)Middle incomeMoldovaMongoliaMontenegroMoroccoMozambiqueMyanmarNamibiaNepalNetherlandsNew ZealandNicaraguaNigerNigeriaNorth AmericaNorwayOECD membersOmanOther small statesPacific island small statesPakistanPalauPanamaPapua New GuineaParaguayPeruPhilippinesPolandPortugalPost-demographic dividendPre-demographic dividendPuerto RicoQatarRomaniaRussian FederationRwandaSamoaSan MarinoSao Tome and PrincipeSaudi ArabiaSenegalSerbiaSeychellesSierra LeoneSingaporeSlovak RepublicSloveniaSmall statesSomaliaSouth AfricaSouth AsiaSouth Asia (IDA & IBRD)SpainSri LankaSt. Kitts and NevisSt. LuciaSt. Vincent and the GrenadinesSub-Saharan Africa Sub-Saharan Africa (excluding high income)Sub-Saharan Africa (IDA & IBRD countries)SudanSurinameSwazilandSwedenSwitzerlandSyrian Arab RepublicTajikistanTanzaniaThailandTimor-LesteTogoTongaTrinidad and TobagoTunisiaTurkeyTurkmenistanUgandaUkraineUnited Arab EmiratesUnited KingdomUnited StatesUpper middle incomeUruguayUzbekistanVanuatuVenezuela, RBVietnamWest Bank and GazaWorldYemen, Rep.ZambiaZimbabwe Timeline:
This timeline shows a graph from 1971 to 2015 of Colombia. No data until 1970. Number of actual observations by date: 35.
Source name:
World Development Indicators
Source organization:
United Nations Educational, Scientific, and Cultural Organization (UNESCO) Institute for Statistics.
Categories, topics:
Education, Gender
Last updated:
apr 23, 2017
Indicators value changes by year
Maximum:
47.867
jan 1, 2015
At the date of observation
Value
Absolute change
Change from previous value
jan 1, 1971
5.812
+5.812
0.0%
jan 1, 1975
7.663
+1.851
31.85%
jan 1, 1976
8.626
+0.963
12.57%
jan 1, 1978
10.174
+1.548
17.94%
jan 1, 1979
10.315
+0.141
1.38%
jan 1, 1980
10.37
+0.055
0.53%
jan 1, 1981
9.608
-0.762
-7.35%
jan 1, 1982
10.977
+1.37
14.26%
jan 1, 1983
10.993
+0.016
0.14%
jan 1, 1985
11.315
+0.322
2.93%
jan 1, 1986
11.277
-0.038
-0.34%
jan 1, 1987
11.822
+0.545
4.83%
jan 1, 1988
12.106
+0.284
2.4%
jan 1, 1989
12.988
+0.882
7.29%
jan 1, 1990
12.756
-0.232
-1.79%
jan 1, 1992
14.225
+1.469
11.52%
jan 1, 1996
15.776
+1.552
10.91%
jan 1, 1997
16.482
+0.705
4.47%
jan 1, 1998
19.029
+2.547
15.46%
jan 1, 1999
22.572
+3.543
18.62%
jan 1, 2000
21.015
-1.557
-6.9%
jan 1, 2001
22.202
+1.187
5.65%
jan 1, 2002
22.786
+0.583
2.63%
jan 1, 2003
22.992
+0.206
0.91%
jan 1, 2005
25.592
+2.6
11.31%
jan 1, 2006
28.031
+2.439
9.53%
jan 1, 2007
30.009
+1.978
7.06%
jan 1, 2008
31.216
+1.207
4.02%
jan 1, 2009
35.394
+4.178
13.38%
jan 1, 2010
36.164
+0.771
2.18%
jan 1, 2011
37.589
+1.424
3.94%
jan 1, 2012
41.487
+3.898
10.37%
jan 1, 2013
43.453
+1.966
4.74%
jan 1, 2014
46.757
+3.304
7.6%
jan 1, 2015
47.867
+1.11
2.37%
Ranking of countries by current statistics by years


Comments: