29
/
en
AIzaSyAYiBZKx7MnpbEhh9jyipgxe19OcubqV5w
April 1, 2024
26119
Central Europe and the Baltics
CEB
false
2
1
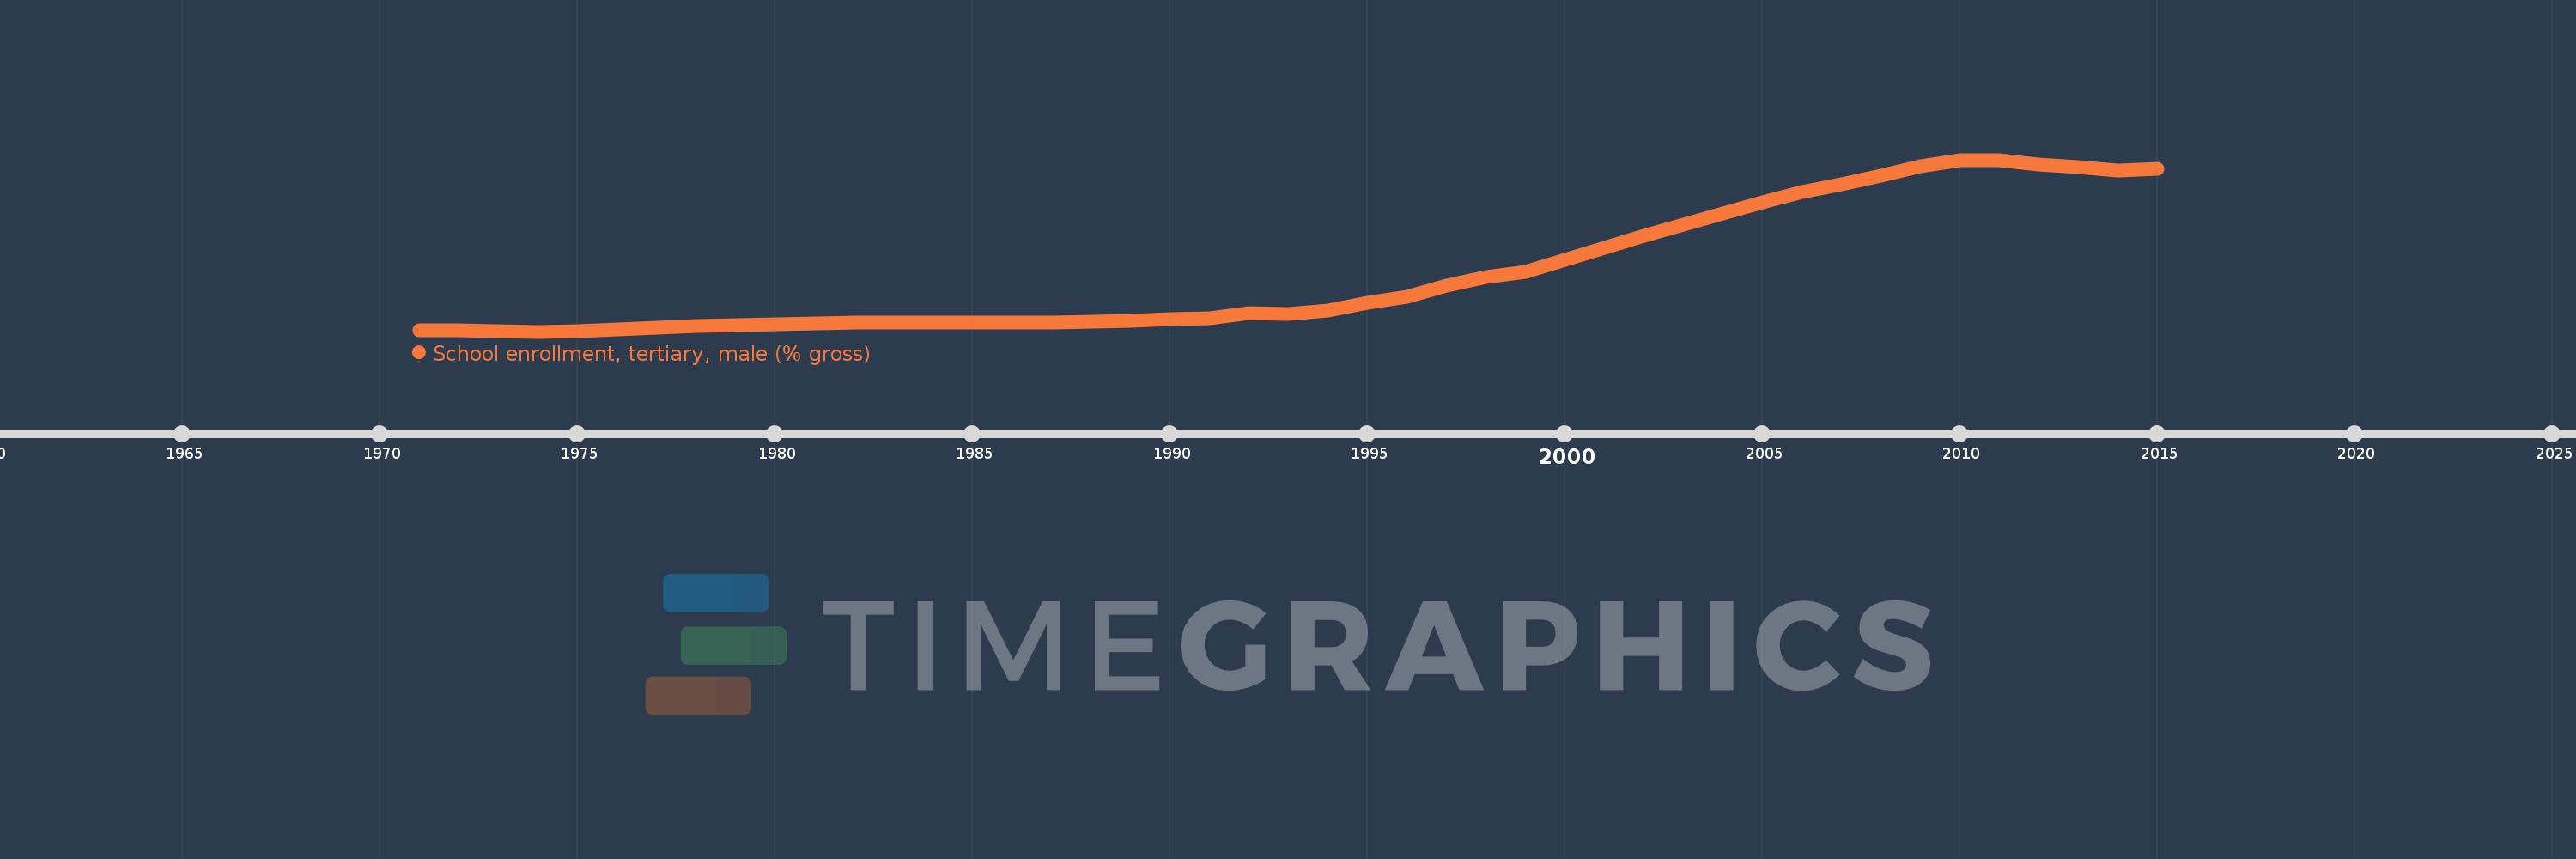
School enrollment, tertiary, male (% gross)
2015,2014,2013,2012,2011,2010,2009,2008,2007,2006,2005,2004,2003,2002,2001,2000,1999,1998,1997,1996,1995,1994,1993,1992,1991,1990,1989,1988,1987,1986,1985,1984,1983,1982,1981,1980,1979,1978,1977,1976,1975,1974,1973,1972,1971
This statistics in other country:
AfghanistanAlbaniaAlgeriaAngolaAntigua and BarbudaArab WorldArgentinaArmeniaArubaAustraliaAustriaAzerbaijanBahamas, TheBahrainBangladeshBarbadosBelarusBelgiumBelizeBeninBermudaBhutanBoliviaBosnia and HerzegovinaBotswanaBrazilBrunei DarussalamBulgariaBurkina FasoBurundiCabo VerdeCambodiaCameroonCanadaCaribbean small statesCentral African RepublicCentral Europe and the BalticsChadChileChinaColombiaComorosCongo, Dem. Rep.Congo, Rep.Costa RicaCote d'IvoireCroatiaCubaCuracaoCyprusCzech RepublicDenmarkDjiboutiDominicaDominican RepublicEarly-demographic dividendEast Asia & PacificEast Asia & Pacific (excluding high income)East Asia & Pacific (IDA & IBRD countries)EcuadorEgypt, Arab Rep.El SalvadorEquatorial GuineaEritreaEstoniaEthiopiaEuro areaEurope & Central AsiaEurope & Central Asia (excluding high income)Europe & Central Asia (IDA & IBRD countries)European UnionFijiFinlandFragile and conflict affected situationsFranceGabonGambia, TheGeorgiaGermanyGhanaGreeceGrenadaGuatemalaGuineaGuinea-BissauGuyanaHaitiHeavily indebted poor countries (HIPC)High incomeHondurasHong Kong SAR, ChinaHungaryIBRD onlyIcelandIDA & IBRD totalIDA blendIDA onlyIDA totalIndiaIndonesiaIran, Islamic Rep.IraqIrelandIsraelItalyJamaicaJapanJordanKazakhstanKenyaKorea, Dem. People’s Rep.Korea, Rep.KuwaitKyrgyz RepublicLao PDRLate-demographic dividendLatin America & Caribbean Latin America & Caribbean (excluding high income)Latin America & the Caribbean (IDA & IBRD countries)LatviaLeast developed countries: UN classificationLebanonLesothoLiberiaLibyaLiechtensteinLithuaniaLow & middle incomeLow incomeLower middle incomeLuxembourgMacao SAR, ChinaMacedonia, FYRMadagascarMalawiMaldivesMaliMaltaMarshall IslandsMauritaniaMauritiusMexicoMicronesia, Fed. Sts.Middle East & North AfricaMiddle East & North Africa (excluding high income)Middle East & North Africa (IDA & IBRD countries)Middle incomeMoldovaMongoliaMontenegroMoroccoMozambiqueMyanmarNamibiaNepalNetherlandsNew ZealandNicaraguaNigerNigeriaNorth AmericaNorwayOECD membersOmanOther small statesPacific island small statesPakistanPalauPanamaPapua New GuineaParaguayPeruPhilippinesPolandPortugalPost-demographic dividendPre-demographic dividendPuerto RicoQatarRomaniaRussian FederationRwandaSamoaSan MarinoSao Tome and PrincipeSaudi ArabiaSenegalSerbiaSeychellesSierra LeoneSingaporeSlovak RepublicSloveniaSmall statesSomaliaSouth AfricaSouth AsiaSouth Asia (IDA & IBRD)SpainSri LankaSt. Kitts and NevisSt. LuciaSt. Vincent and the GrenadinesSub-Saharan Africa Sub-Saharan Africa (excluding high income)Sub-Saharan Africa (IDA & IBRD countries)SudanSurinameSwazilandSwedenSwitzerlandSyrian Arab RepublicTajikistanTanzaniaThailandTimor-LesteTogoTongaTrinidad and TobagoTunisiaTurkeyTurkmenistanUgandaUkraineUnited Arab EmiratesUnited KingdomUnited StatesUpper middle incomeUruguayUzbekistanVanuatuVenezuela, RBVietnamWest Bank and GazaWorldYemen, Rep.ZambiaZimbabwe Timeline:
This timeline shows a graph from 1971 to 2015 of Central Europe and the Baltics. No data until 1970. Number of actual observations by date: 45.
Source name:
World Development Indicators
Source organization:
United Nations Educational, Scientific, and Cultural Organization (UNESCO) Institute for Statistics.
Categories, topics:
Education, Gender
Last updated:
apr 23, 2017
Indicators value changes by year
At the date of observation
Value
Absolute change
Change from previous value
jan 1, 1971
13.448
+13.448
0.0%
jan 1, 1972
13.423
-0.025
-0.18%
jan 1, 1973
13.087
-0.337
-2.51%
jan 1, 1974
13.03
-0.057
-0.43%
jan 1, 1975
13.172
+0.142
1.09%
jan 1, 1976
13.494
+0.322
2.45%
jan 1, 1977
14.012
+0.518
3.84%
jan 1, 1978
14.429
+0.417
2.98%
jan 1, 1979
14.713
+0.284
1.97%
jan 1, 1980
14.948
+0.235
1.6%
jan 1, 1981
15.045
+0.097
0.65%
jan 1, 1982
15.206
+0.16
1.07%
jan 1, 1983
15.278
+0.073
0.48%
jan 1, 1984
15.269
-0.01
-0.06%
jan 1, 1985
15.363
+0.094
0.62%
jan 1, 1986
15.356
-0.006
-0.04%
jan 1, 1987
15.303
-0.054
-0.35%
jan 1, 1988
15.421
+0.118
0.77%
jan 1, 1989
15.621
+0.201
1.3%
jan 1, 1990
16.194
+0.573
3.66%
jan 1, 1991
16.353
+0.159
0.98%
jan 1, 1992
17.552
+1.199
7.33%
jan 1, 1993
17.349
-0.203
-1.16%
jan 1, 1994
18.396
+1.047
6.04%
jan 1, 1995
20.296
+1.9
10.33%
jan 1, 1996
21.821
+1.525
7.51%
jan 1, 1997
24.498
+2.677
12.27%
jan 1, 1998
26.73
+2.232
9.11%
jan 1, 1999
28.016
+1.286
4.81%
jan 1, 2000
31.056
+3.04
10.85%
jan 1, 2001
33.976
+2.92
9.4%
jan 1, 2002
37.014
+3.038
8.94%
jan 1, 2003
39.823
+2.81
7.59%
jan 1, 2004
42.652
+2.829
7.1%
jan 1, 2005
45.307
+2.655
6.22%
jan 1, 2006
47.958
+2.652
5.85%
jan 1, 2007
49.876
+1.918
4.0%
jan 1, 2008
52.019
+2.143
4.3%
jan 1, 2009
54.439
+2.42
4.65%
jan 1, 2010
56.0
+1.561
2.87%
jan 1, 2011
55.858
-0.142
-0.25%
jan 1, 2012
54.794
-1.064
-1.9%
jan 1, 2013
54.223
-0.571
-1.04%
jan 1, 2014
53.4
-0.823
-1.52%
jan 1, 2015
53.643
+0.243
0.45%
Ranking of countries by current statistics by years


Comments: