29
/
en
AIzaSyAYiBZKx7MnpbEhh9jyipgxe19OcubqV5w
April 1, 2024
35373
Heavily indebted poor countries (HIPC)
HPC
false
2
1
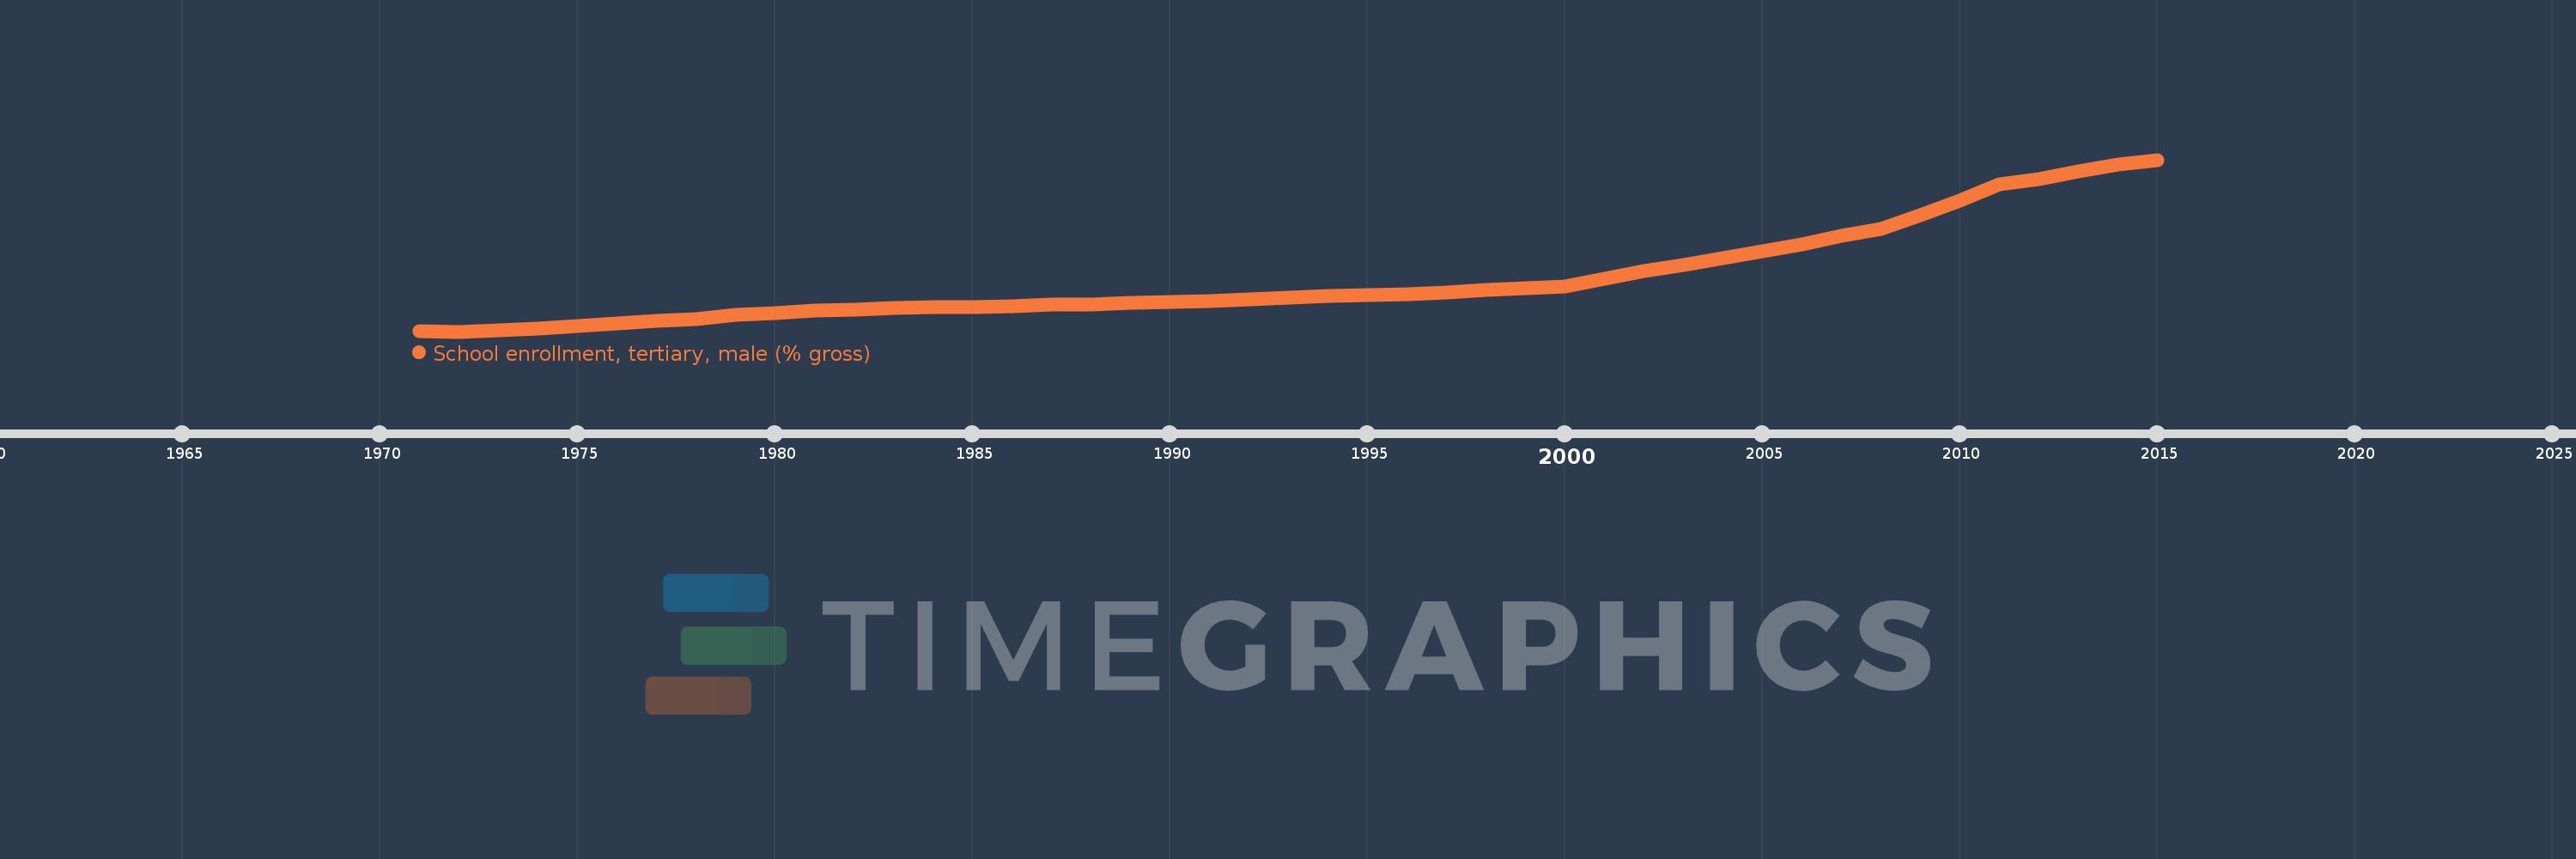
School enrollment, tertiary, male (% gross)
2015,2014,2013,2012,2011,2010,2009,2008,2007,2006,2005,2004,2003,2002,2001,2000,1999,1998,1997,1996,1995,1994,1993,1992,1991,1990,1989,1988,1987,1986,1985,1984,1983,1982,1981,1980,1979,1978,1977,1976,1975,1974,1973,1972,1971
This statistics in other country:
AfghanistanAlbaniaAlgeriaAngolaAntigua and BarbudaArab WorldArgentinaArmeniaArubaAustraliaAustriaAzerbaijanBahamas, TheBahrainBangladeshBarbadosBelarusBelgiumBelizeBeninBermudaBhutanBoliviaBosnia and HerzegovinaBotswanaBrazilBrunei DarussalamBulgariaBurkina FasoBurundiCabo VerdeCambodiaCameroonCanadaCaribbean small statesCentral African RepublicCentral Europe and the BalticsChadChileChinaColombiaComorosCongo, Dem. Rep.Congo, Rep.Costa RicaCote d'IvoireCroatiaCubaCuracaoCyprusCzech RepublicDenmarkDjiboutiDominicaDominican RepublicEarly-demographic dividendEast Asia & PacificEast Asia & Pacific (excluding high income)East Asia & Pacific (IDA & IBRD countries)EcuadorEgypt, Arab Rep.El SalvadorEquatorial GuineaEritreaEstoniaEthiopiaEuro areaEurope & Central AsiaEurope & Central Asia (excluding high income)Europe & Central Asia (IDA & IBRD countries)European UnionFijiFinlandFragile and conflict affected situationsFranceGabonGambia, TheGeorgiaGermanyGhanaGreeceGrenadaGuatemalaGuineaGuinea-BissauGuyanaHaitiHeavily indebted poor countries (HIPC)High incomeHondurasHong Kong SAR, ChinaHungaryIBRD onlyIcelandIDA & IBRD totalIDA blendIDA onlyIDA totalIndiaIndonesiaIran, Islamic Rep.IraqIrelandIsraelItalyJamaicaJapanJordanKazakhstanKenyaKorea, Dem. People’s Rep.Korea, Rep.KuwaitKyrgyz RepublicLao PDRLate-demographic dividendLatin America & Caribbean Latin America & Caribbean (excluding high income)Latin America & the Caribbean (IDA & IBRD countries)LatviaLeast developed countries: UN classificationLebanonLesothoLiberiaLibyaLiechtensteinLithuaniaLow & middle incomeLow incomeLower middle incomeLuxembourgMacao SAR, ChinaMacedonia, FYRMadagascarMalawiMaldivesMaliMaltaMarshall IslandsMauritaniaMauritiusMexicoMicronesia, Fed. Sts.Middle East & North AfricaMiddle East & North Africa (excluding high income)Middle East & North Africa (IDA & IBRD countries)Middle incomeMoldovaMongoliaMontenegroMoroccoMozambiqueMyanmarNamibiaNepalNetherlandsNew ZealandNicaraguaNigerNigeriaNorth AmericaNorwayOECD membersOmanOther small statesPacific island small statesPakistanPalauPanamaPapua New GuineaParaguayPeruPhilippinesPolandPortugalPost-demographic dividendPre-demographic dividendPuerto RicoQatarRomaniaRussian FederationRwandaSamoaSan MarinoSao Tome and PrincipeSaudi ArabiaSenegalSerbiaSeychellesSierra LeoneSingaporeSlovak RepublicSloveniaSmall statesSomaliaSouth AfricaSouth AsiaSouth Asia (IDA & IBRD)SpainSri LankaSt. Kitts and NevisSt. LuciaSt. Vincent and the GrenadinesSub-Saharan Africa Sub-Saharan Africa (excluding high income)Sub-Saharan Africa (IDA & IBRD countries)SudanSurinameSwazilandSwedenSwitzerlandSyrian Arab RepublicTajikistanTanzaniaThailandTimor-LesteTogoTongaTrinidad and TobagoTunisiaTurkeyTurkmenistanUgandaUkraineUnited Arab EmiratesUnited KingdomUnited StatesUpper middle incomeUruguayUzbekistanVanuatuVenezuela, RBVietnamWest Bank and GazaWorldYemen, Rep.ZambiaZimbabwe Timeline:
This timeline shows a graph from 1971 to 2015 of Heavily indebted poor countries (HIPC). No data until 1970. Number of actual observations by date: 45.
Source name:
World Development Indicators
Source organization:
United Nations Educational, Scientific, and Cultural Organization (UNESCO) Institute for Statistics.
Categories, topics:
Education, Gender
Last updated:
apr 23, 2017
Indicators value changes by year
At the date of observation
Value
Absolute change
Change from previous value
jan 1, 1971
1.787
+1.787
0.0%
jan 1, 1972
1.773
-0.014
-0.79%
jan 1, 1973
1.853
+0.08
4.5%
jan 1, 1974
1.922
+0.069
3.73%
jan 1, 1975
2.048
+0.126
6.57%
jan 1, 1976
2.167
+0.118
5.78%
jan 1, 1977
2.279
+0.112
5.19%
jan 1, 1978
2.351
+0.072
3.17%
jan 1, 1979
2.558
+0.207
8.78%
jan 1, 1980
2.672
+0.114
4.45%
jan 1, 1981
2.777
+0.105
3.95%
jan 1, 1982
2.836
+0.059
2.12%
jan 1, 1983
2.885
+0.049
1.74%
jan 1, 1984
2.931
+0.045
1.58%
jan 1, 1985
2.959
+0.028
0.96%
jan 1, 1986
2.996
+0.037
1.24%
jan 1, 1987
3.081
+0.085
2.85%
jan 1, 1988
3.073
-0.008
-0.26%
jan 1, 1989
3.15
+0.077
2.51%
jan 1, 1990
3.197
+0.047
1.49%
jan 1, 1991
3.245
+0.048
1.51%
jan 1, 1992
3.329
+0.084
2.58%
jan 1, 1993
3.383
+0.054
1.62%
jan 1, 1994
3.471
+0.088
2.62%
jan 1, 1995
3.518
+0.047
1.34%
jan 1, 1996
3.564
+0.046
1.3%
jan 1, 1997
3.636
+0.072
2.02%
jan 1, 1998
3.767
+0.132
3.62%
jan 1, 1999
3.834
+0.067
1.77%
jan 1, 2000
3.94
+0.106
2.75%
jan 1, 2001
4.299
+0.36
9.13%
jan 1, 2002
4.681
+0.381
8.87%
jan 1, 2003
4.947
+0.266
5.68%
jan 1, 2004
5.273
+0.326
6.59%
jan 1, 2005
5.626
+0.353
6.69%
jan 1, 2006
5.965
+0.34
6.04%
jan 1, 2007
6.34
+0.375
6.28%
jan 1, 2008
6.676
+0.337
5.31%
jan 1, 2009
7.342
+0.665
9.97%
jan 1, 2010
8.026
+0.684
9.32%
jan 1, 2011
8.807
+0.781
9.73%
jan 1, 2012
9.092
+0.285
3.24%
jan 1, 2013
9.428
+0.337
3.7%
jan 1, 2014
9.777
+0.348
3.7%
jan 1, 2015
9.999
+0.223
2.28%
Ranking of countries by current statistics by years


Comments: