29
/
en
AIzaSyAYiBZKx7MnpbEhh9jyipgxe19OcubqV5w
April 1, 2024
93491
Bulgaria
BGR
true
2
1
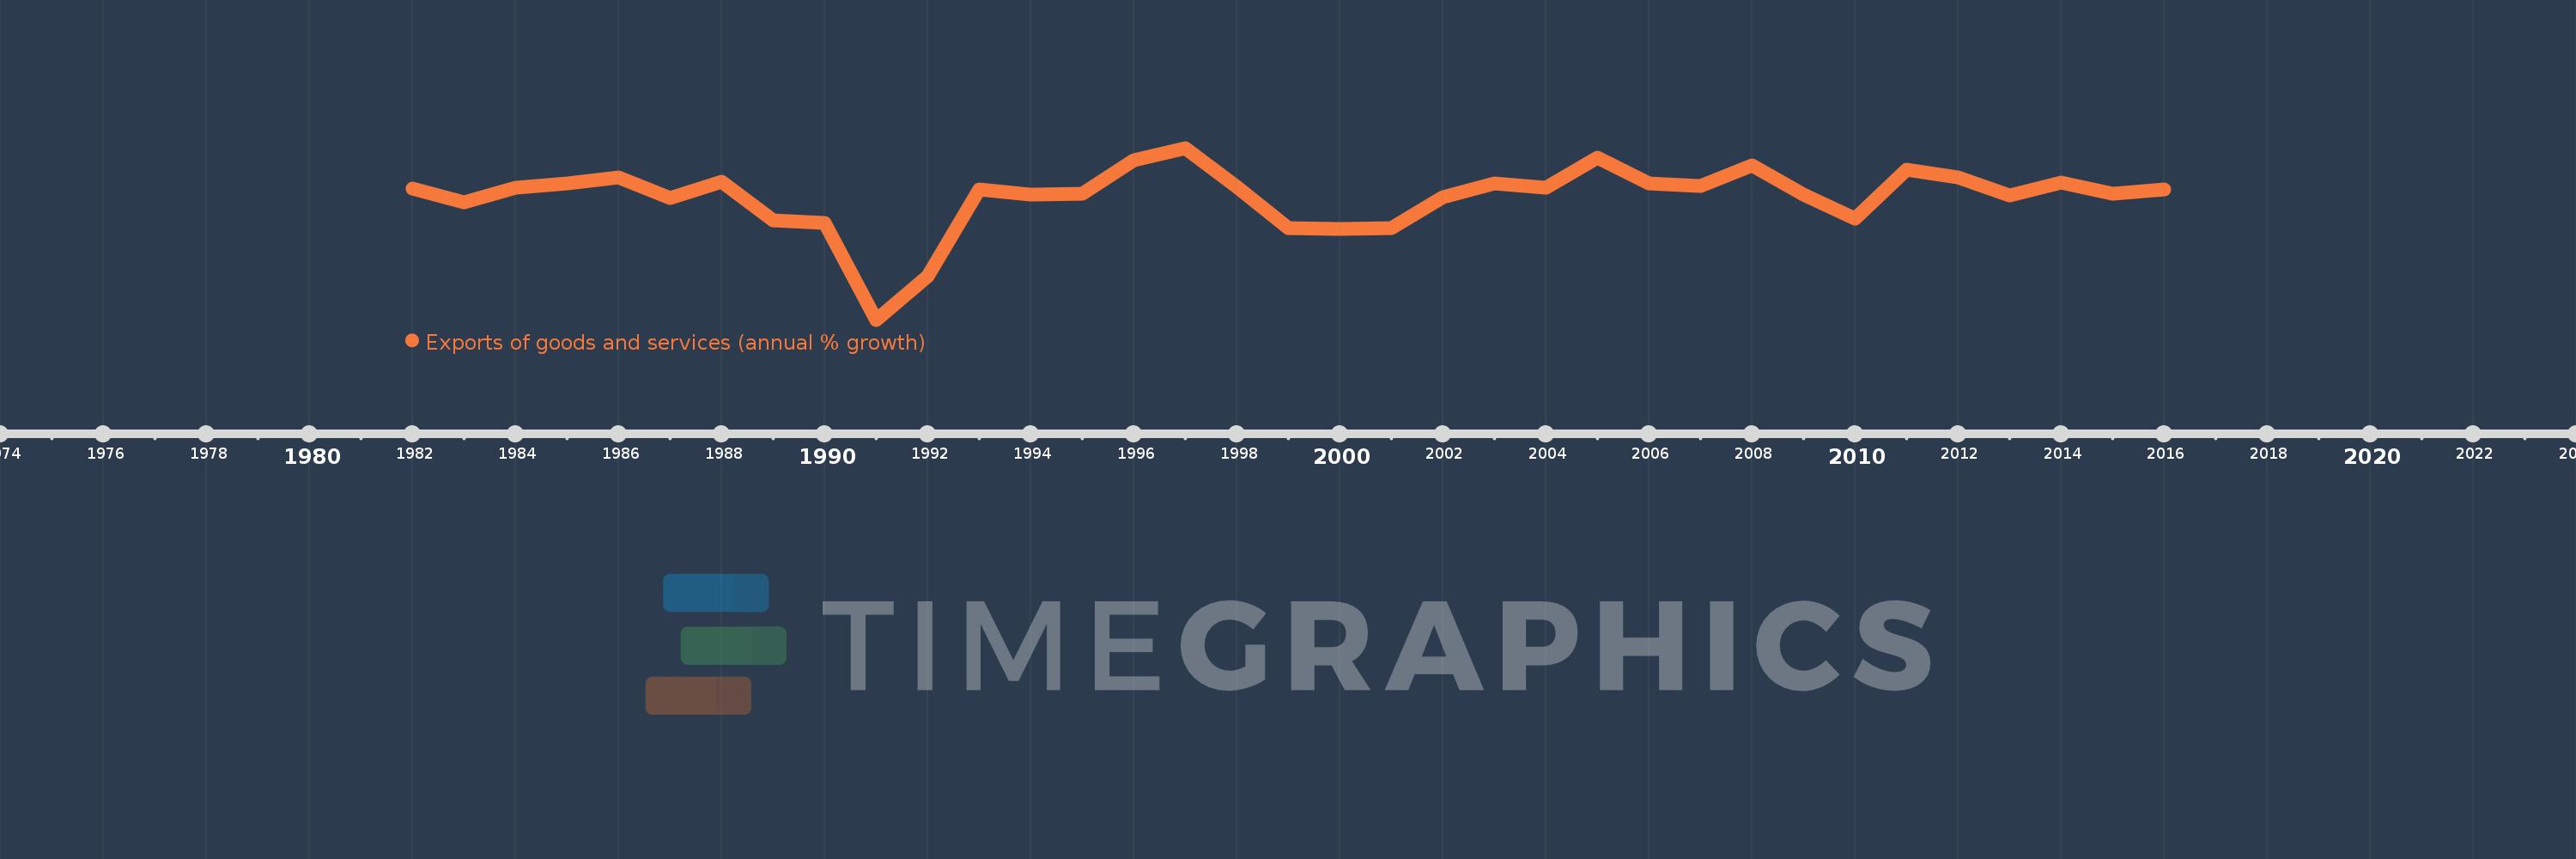
Exports of goods and services (annual % growth)
2016,2015,2014,2013,2012,2011,2010,2009,2008,2007,2006,2005,2004,2003,2002,2001,2000,1999,1998,1997,1996,1995,1994,1993,1992,1991,1990,1989,1988,1987,1986,1985,1984,1983,1982
This statistics in other country:
AlbaniaAlgeriaAngolaAntigua and BarbudaArab WorldArgentinaArmeniaAustraliaAustriaAzerbaijanBahamas, TheBahrainBangladeshBarbadosBelarusBelgiumBelizeBeninBhutanBoliviaBosnia and HerzegovinaBotswanaBrazilBrunei DarussalamBulgariaBurkina FasoBurundiCabo VerdeCambodiaCameroonCanadaCaribbean small statesCentral Europe and the BalticsChadChileColombiaComorosCongo, Dem. Rep.Congo, Rep.Costa RicaCote d'IvoireCroatiaCubaCyprusCzech RepublicDenmarkDjiboutiDominican RepublicEarly-demographic dividendEast Asia & PacificEcuadorEgypt, Arab Rep.El SalvadorEquatorial GuineaEritreaEstoniaEthiopiaEuro areaEurope & Central AsiaEurope & Central Asia (excluding high income)Europe & Central Asia (IDA & IBRD countries)European UnionFijiFinlandFranceGabonGambia, TheGeorgiaGermanyGhanaGreeceGuatemalaGuineaGuinea-BissauHaitiHeavily indebted poor countries (HIPC)High incomeHondurasHong Kong SAR, ChinaHungaryIBRD onlyIcelandIDA & IBRD totalIDA blendIDA onlyIDA totalIndiaIndonesiaIran, Islamic Rep.IrelandIsraelItalyJamaicaJapanJordanKazakhstanKenyaKorea, Rep.KosovoKuwaitKyrgyz RepublicLao PDRLatin America & Caribbean Latin America & Caribbean (excluding high income)Latin America & the Caribbean (IDA & IBRD countries)LatviaLebanonLiberiaLibyaLithuaniaLow & middle incomeLow incomeLower middle incomeLuxembourgMacao SAR, ChinaMacedonia, FYRMadagascarMalawiMalaysiaMaliMaltaMauritaniaMauritiusMexicoMiddle East & North AfricaMiddle East & North Africa (excluding high income)Middle East & North Africa (IDA & IBRD countries)Middle incomeMoldovaMongoliaMontenegroMoroccoMozambiqueMyanmarNamibiaNepalNetherlandsNew ZealandNicaraguaNigerNigeriaNorth AmericaNorwayOECD membersOmanOther small statesPakistanPanamaPapua New GuineaParaguayPeruPhilippinesPolandPortugalPost-demographic dividendPre-demographic dividendPuerto RicoQatarRomaniaRussian FederationRwandaSamoaSaudi ArabiaSenegalSerbiaSeychellesSierra LeoneSingaporeSlovak RepublicSloveniaSmall statesSomaliaSouth AfricaSouth AsiaSouth Asia (IDA & IBRD)South SudanSpainSri LankaSub-Saharan Africa Sub-Saharan Africa (excluding high income)Sub-Saharan Africa (IDA & IBRD countries)SudanSurinameSwazilandSwedenSwitzerlandSyrian Arab RepublicTajikistanTanzaniaThailandTimor-LesteTogoTrinidad and TobagoTunisiaTurkeyTurkmenistanUgandaUkraineUnited Arab EmiratesUnited KingdomUnited StatesUruguayUzbekistanVanuatuVenezuela, RBVietnamWest Bank and GazaWorldZambiaZimbabwe Timeline:
This timeline shows a graph from 1982 to 2016 of Bulgaria. No data until 1981. Number of actual observations by date: 35.
Source name:
World Development Indicators
Source organization:
World Bank national accounts data, and OECD National Accounts data files.
Categories, topics:
Economy & Growth, Trade
Last updated:
apr 23, 2017
Indicators value changes by year
Minimum:
-71.355
jan 1, 1991
At the date of observation
Value
Absolute change
Change from previous value
jan 1, 1982
5.905
+5.905
0.0%
jan 1, 1983
-2.006
-7.911
-133.98%
jan 1, 1984
6.422
+8.428
-420.08%
jan 1, 1985
9.253
+2.831
44.09%
jan 1, 1986
12.581
+3.328
35.96%
jan 1, 1987
0.656
-11.925
-94.78%
jan 1, 1988
10.289
+9.632
1.47K%
jan 1, 1989
-12.748
-23.036
-223.9%
jan 1, 1990
-14.032
-1.284
10.07%
jan 1, 1991
-71.355
-57.323
408.51%
jan 1, 1992
-45.52
+25.835
-36.21%
jan 1, 1993
5.702
+51.222
-112.53%
jan 1, 1994
2.397
-3.305
-57.96%
jan 1, 1995
2.768
+0.371
15.5%
jan 1, 1996
22.764
+19.996
722.3%
jan 1, 1997
30.0
+7.236
31.79%
jan 1, 1998
7.093
-22.907
-76.36%
jan 1, 1999
-17.368
-24.461
-344.87%
jan 1, 2000
-17.72
-0.352
2.02%
jan 1, 2001
-17.161
+0.559
-3.16%
jan 1, 2002
1.215
+18.376
-107.08%
jan 1, 2003
8.858
+7.643
629.07%
jan 1, 2004
6.463
-2.395
-27.04%
jan 1, 2005
24.508
+18.045
279.23%
jan 1, 2006
9.086
-15.422
-62.92%
jan 1, 2007
7.663
-1.423
-15.66%
jan 1, 2008
19.623
+11.959
156.06%
jan 1, 2009
2.478
-17.145
-87.37%
jan 1, 2010
-11.716
-14.193
-572.81%
jan 1, 2011
17.19
+28.906
-246.73%
jan 1, 2012
12.576
-4.614
-26.84%
jan 1, 2013
2.036
-10.54
-83.81%
jan 1, 2014
9.641
+7.606
373.58%
jan 1, 2015
3.125
-6.517
-67.59%
jan 1, 2016
5.737
+2.612
83.58%
Ranking of countries by current statistics by years


Comments: