29
/
en
AIzaSyAYiBZKx7MnpbEhh9jyipgxe19OcubqV5w
April 1, 2024
99847
Cameroon
CMR
true
2
1
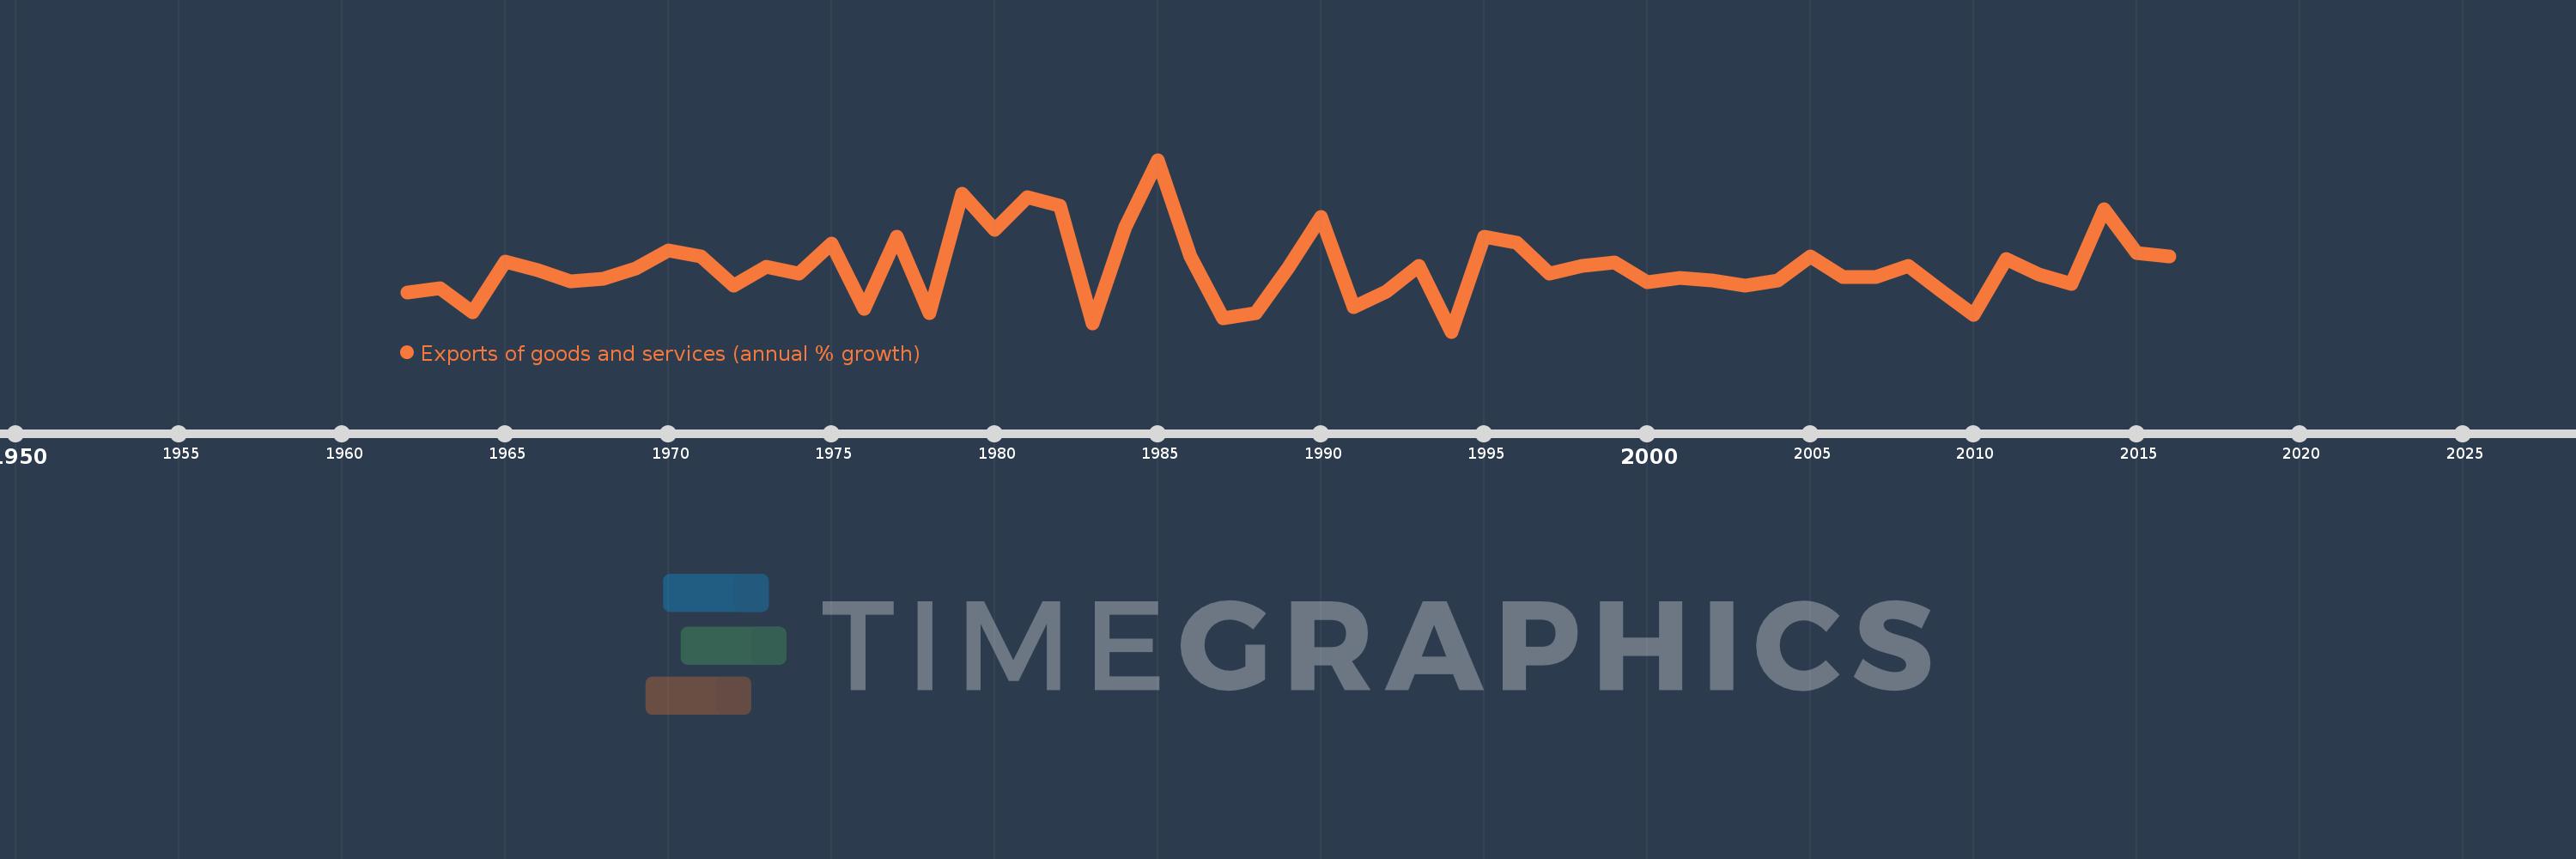
Exports of goods and services (annual % growth)
2016,2015,2014,2013,2012,2011,2010,2009,2008,2007,2006,2005,2004,2003,2002,2001,2000,1999,1998,1997,1996,1995,1994,1993,1992,1991,1990,1989,1988,1987,1986,1985,1984,1983,1982,1981,1980,1979,1978,1977,1976,1975,1974,1973,1972,1971,1970,1969,1968,1967,1966,1965,1964,1963,1962
This statistics in other country:
AlbaniaAlgeriaAngolaAntigua and BarbudaArab WorldArgentinaArmeniaAustraliaAustriaAzerbaijanBahamas, TheBahrainBangladeshBarbadosBelarusBelgiumBelizeBeninBhutanBoliviaBosnia and HerzegovinaBotswanaBrazilBrunei DarussalamBulgariaBurkina FasoBurundiCabo VerdeCambodiaCameroonCanadaCaribbean small statesCentral Europe and the BalticsChadChileColombiaComorosCongo, Dem. Rep.Congo, Rep.Costa RicaCote d'IvoireCroatiaCubaCyprusCzech RepublicDenmarkDjiboutiDominican RepublicEarly-demographic dividendEast Asia & PacificEcuadorEgypt, Arab Rep.El SalvadorEquatorial GuineaEritreaEstoniaEthiopiaEuro areaEurope & Central AsiaEurope & Central Asia (excluding high income)Europe & Central Asia (IDA & IBRD countries)European UnionFijiFinlandFranceGabonGambia, TheGeorgiaGermanyGhanaGreeceGuatemalaGuineaGuinea-BissauHaitiHeavily indebted poor countries (HIPC)High incomeHondurasHong Kong SAR, ChinaHungaryIBRD onlyIcelandIDA & IBRD totalIDA blendIDA onlyIDA totalIndiaIndonesiaIran, Islamic Rep.IrelandIsraelItalyJamaicaJapanJordanKazakhstanKenyaKorea, Rep.KosovoKuwaitKyrgyz RepublicLao PDRLatin America & Caribbean Latin America & Caribbean (excluding high income)Latin America & the Caribbean (IDA & IBRD countries)LatviaLebanonLiberiaLibyaLithuaniaLow & middle incomeLow incomeLower middle incomeLuxembourgMacao SAR, ChinaMacedonia, FYRMadagascarMalawiMalaysiaMaliMaltaMauritaniaMauritiusMexicoMiddle East & North AfricaMiddle East & North Africa (excluding high income)Middle East & North Africa (IDA & IBRD countries)Middle incomeMoldovaMongoliaMontenegroMoroccoMozambiqueMyanmarNamibiaNepalNetherlandsNew ZealandNicaraguaNigerNigeriaNorth AmericaNorwayOECD membersOmanOther small statesPakistanPanamaPapua New GuineaParaguayPeruPhilippinesPolandPortugalPost-demographic dividendPre-demographic dividendPuerto RicoQatarRomaniaRussian FederationRwandaSamoaSaudi ArabiaSenegalSerbiaSeychellesSierra LeoneSingaporeSlovak RepublicSloveniaSmall statesSomaliaSouth AfricaSouth AsiaSouth Asia (IDA & IBRD)South SudanSpainSri LankaSub-Saharan Africa Sub-Saharan Africa (excluding high income)Sub-Saharan Africa (IDA & IBRD countries)SudanSurinameSwazilandSwedenSwitzerlandSyrian Arab RepublicTajikistanTanzaniaThailandTimor-LesteTogoTrinidad and TobagoTunisiaTurkeyTurkmenistanUgandaUkraineUnited Arab EmiratesUnited KingdomUnited StatesUruguayUzbekistanVanuatuVenezuela, RBVietnamWest Bank and GazaWorldZambiaZimbabwe Timeline:
This timeline shows a graph from 1962 to 2016 of Cameroon. No data until 1961. Number of actual observations by date: 55.
Source name:
World Development Indicators
Source organization:
World Bank national accounts data, and OECD National Accounts data files.
Categories, topics:
Economy & Growth, Trade
Last updated:
apr 23, 2017
Indicators value changes by year
Minimum:
-18.734
jan 1, 1994
Maximum:
44.274
jan 1, 1985
At the date of observation
Value
Absolute change
Change from previous value
jan 1, 1962
-4.26
-4.26
0.0%
jan 1, 1963
-2.913
+1.348
-31.63%
jan 1, 1964
-11.583
-8.671
297.69%
jan 1, 1965
6.88
+18.464
-159.4%
jan 1, 1966
3.755
-3.125
-45.42%
jan 1, 1967
-0.339
-4.094
-109.03%
jan 1, 1968
0.54
+0.879
-259.3%
jan 1, 1969
4.329
+3.789
701.73%
jan 1, 1970
10.984
+6.655
153.72%
jan 1, 1971
8.944
-2.04
-18.57%
jan 1, 1972
-1.75
-10.695
-119.57%
jan 1, 1973
5.0
+6.75
-385.71%
jan 1, 1974
2.609
-2.391
-47.82%
jan 1, 1975
13.668
+11.059
423.87%
jan 1, 1976
-10.291
-23.959
-175.29%
jan 1, 1977
16.085
+26.376
-256.3%
jan 1, 1978
-11.923
-28.008
-174.12%
jan 1, 1979
31.769
+43.692
-366.46%
jan 1, 1980
18.574
-13.196
-41.54%
jan 1, 1981
30.682
+12.108
65.19%
jan 1, 1982
27.399
-3.283
-10.7%
jan 1, 1983
-15.797
-43.196
-157.66%
jan 1, 1984
19.581
+35.378
-223.95%
jan 1, 1985
44.274
+24.693
126.11%
jan 1, 1986
8.912
-35.362
-79.87%
jan 1, 1987
-13.851
-22.764
-255.42%
jan 1, 1988
-12.033
+1.818
-13.13%
jan 1, 1989
4.6
+16.633
-138.23%
jan 1, 1990
23.172
+18.572
403.77%
jan 1, 1991
-9.827
-32.999
-142.41%
jan 1, 1992
-4.1
+5.727
-58.28%
jan 1, 1993
5.3
+9.4
-229.27%
jan 1, 1994
-18.734
-24.034
-453.47%
jan 1, 1995
16.116
+34.85
-186.02%
jan 1, 1996
13.863
-2.252
-13.98%
jan 1, 1997
2.552
-11.311
-81.59%
jan 1, 1998
5.341
+2.789
109.3%
jan 1, 1999
6.521
+1.18
22.09%
jan 1, 2000
-0.641
-7.163
-109.83%
jan 1, 2001
0.967
+1.608
-250.81%
jan 1, 2002
-0.017
-0.983
-101.71%
jan 1, 2003
-1.753
-1.737
10.52K%
jan 1, 2004
-0.108
+1.645
-93.83%
jan 1, 2005
8.958
+9.066
-8.38K%
jan 1, 2006
1.41
-7.548
-84.26%
jan 1, 2007
1.313
-0.097
-6.88%
jan 1, 2008
5.338
+4.025
306.52%
jan 1, 2009
-3.689
-9.028
-169.11%
jan 1, 2010
-12.506
-8.817
238.99%
jan 1, 2011
7.789
+20.296
-162.28%
jan 1, 2012
2.247
-5.542
-71.15%
jan 1, 2013
-1.283
-3.53
-157.1%
jan 1, 2014
26.01
+27.293
-2.13K%
jan 1, 2015
10.022
-15.988
-61.47%
jan 1, 2016
8.892
-1.13
-11.27%
Ranking of countries by current statistics by years


Comments: