29
/
en
AIzaSyAYiBZKx7MnpbEhh9jyipgxe19OcubqV5w
April 1, 2024
161413
Italy
ITA
true
2
1
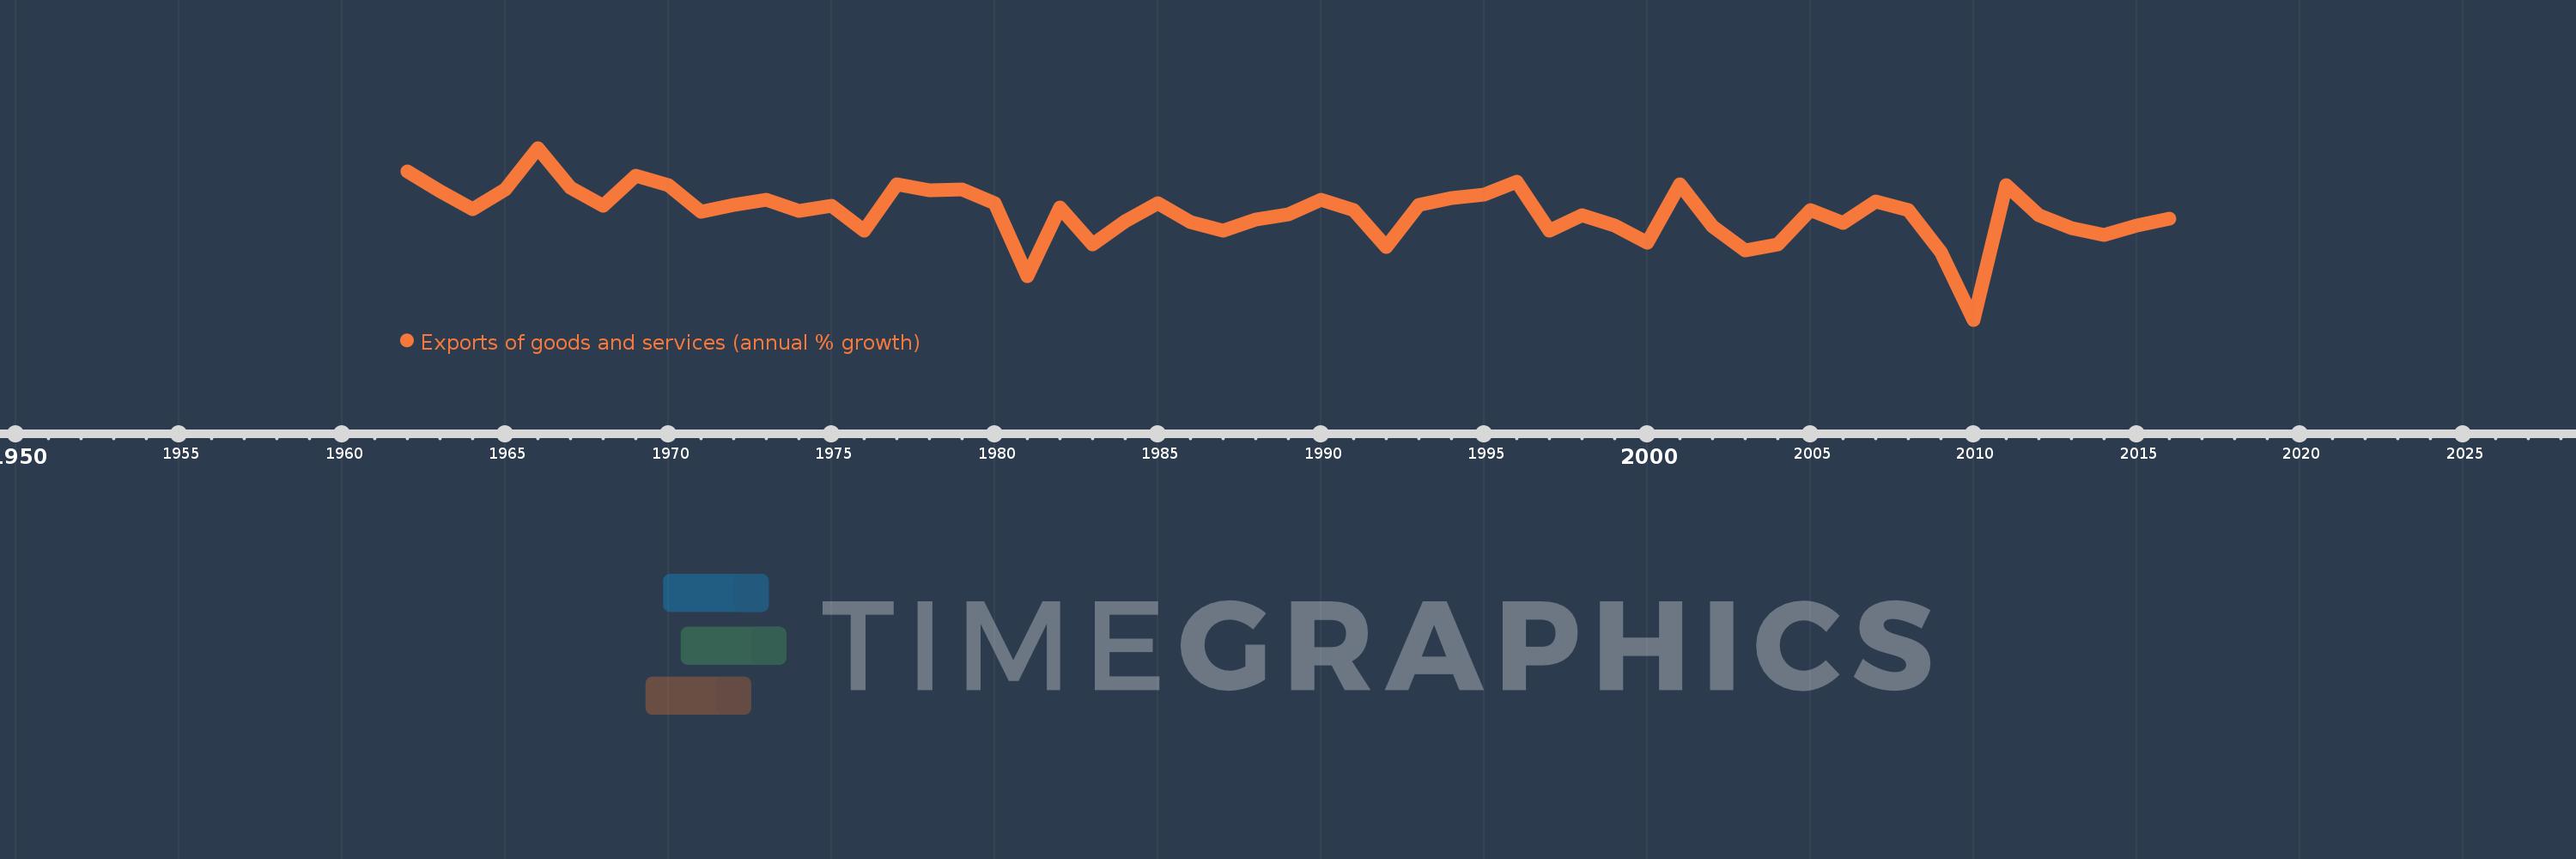
Exports of goods and services (annual % growth)
2016,2015,2014,2013,2012,2011,2010,2009,2008,2007,2006,2005,2004,2003,2002,2001,2000,1999,1998,1997,1996,1995,1994,1993,1992,1991,1990,1989,1988,1987,1986,1985,1984,1983,1982,1981,1980,1979,1978,1977,1976,1975,1974,1973,1972,1971,1970,1969,1968,1967,1966,1965,1964,1963,1962
This statistics in other country:
AlbaniaAlgeriaAngolaAntigua and BarbudaArab WorldArgentinaArmeniaAustraliaAustriaAzerbaijanBahamas, TheBahrainBangladeshBarbadosBelarusBelgiumBelizeBeninBhutanBoliviaBosnia and HerzegovinaBotswanaBrazilBrunei DarussalamBulgariaBurkina FasoBurundiCabo VerdeCambodiaCameroonCanadaCaribbean small statesCentral Europe and the BalticsChadChileColombiaComorosCongo, Dem. Rep.Congo, Rep.Costa RicaCote d'IvoireCroatiaCubaCyprusCzech RepublicDenmarkDjiboutiDominican RepublicEarly-demographic dividendEast Asia & PacificEcuadorEgypt, Arab Rep.El SalvadorEquatorial GuineaEritreaEstoniaEthiopiaEuro areaEurope & Central AsiaEurope & Central Asia (excluding high income)Europe & Central Asia (IDA & IBRD countries)European UnionFijiFinlandFranceGabonGambia, TheGeorgiaGermanyGhanaGreeceGuatemalaGuineaGuinea-BissauHaitiHeavily indebted poor countries (HIPC)High incomeHondurasHong Kong SAR, ChinaHungaryIBRD onlyIcelandIDA & IBRD totalIDA blendIDA onlyIDA totalIndiaIndonesiaIran, Islamic Rep.IrelandIsraelItalyJamaicaJapanJordanKazakhstanKenyaKorea, Rep.KosovoKuwaitKyrgyz RepublicLao PDRLatin America & Caribbean Latin America & Caribbean (excluding high income)Latin America & the Caribbean (IDA & IBRD countries)LatviaLebanonLiberiaLibyaLithuaniaLow & middle incomeLow incomeLower middle incomeLuxembourgMacao SAR, ChinaMacedonia, FYRMadagascarMalawiMalaysiaMaliMaltaMauritaniaMauritiusMexicoMiddle East & North AfricaMiddle East & North Africa (excluding high income)Middle East & North Africa (IDA & IBRD countries)Middle incomeMoldovaMongoliaMontenegroMoroccoMozambiqueMyanmarNamibiaNepalNetherlandsNew ZealandNicaraguaNigerNigeriaNorth AmericaNorwayOECD membersOmanOther small statesPakistanPanamaPapua New GuineaParaguayPeruPhilippinesPolandPortugalPost-demographic dividendPre-demographic dividendPuerto RicoQatarRomaniaRussian FederationRwandaSamoaSaudi ArabiaSenegalSerbiaSeychellesSierra LeoneSingaporeSlovak RepublicSloveniaSmall statesSomaliaSouth AfricaSouth AsiaSouth Asia (IDA & IBRD)South SudanSpainSri LankaSub-Saharan Africa Sub-Saharan Africa (excluding high income)Sub-Saharan Africa (IDA & IBRD countries)SudanSurinameSwazilandSwedenSwitzerlandSyrian Arab RepublicTajikistanTanzaniaThailandTimor-LesteTogoTrinidad and TobagoTunisiaTurkeyTurkmenistanUgandaUkraineUnited Arab EmiratesUnited KingdomUnited StatesUruguayUzbekistanVanuatuVenezuela, RBVietnamWest Bank and GazaWorldZambiaZimbabwe Timeline:
This timeline shows a graph from 1962 to 2016 of Italy. No data until 1961. Number of actual observations by date: 55.
Source name:
World Development Indicators
Source organization:
World Bank national accounts data, and OECD National Accounts data files.
Categories, topics:
Economy & Growth, Trade
Last updated:
apr 23, 2017
Indicators value changes by year
Minimum:
-18.051
jan 1, 2010
Maximum:
19.982
jan 1, 1966
At the date of observation
Value
Absolute change
Change from previous value
jan 1, 1962
14.747
+14.747
0.0%
jan 1, 1963
10.364
-4.383
-29.72%
jan 1, 1964
6.484
-3.88
-37.43%
jan 1, 1965
10.803
+4.319
66.6%
jan 1, 1966
19.982
+9.178
84.96%
jan 1, 1967
11.184
-8.797
-44.03%
jan 1, 1968
7.167
-4.018
-35.92%
jan 1, 1969
13.87
+6.703
93.53%
jan 1, 1970
11.756
-2.114
-15.24%
jan 1, 1971
5.824
-5.932
-50.46%
jan 1, 1972
7.442
+1.618
27.78%
jan 1, 1973
8.468
+1.026
13.78%
jan 1, 1974
5.99
-2.478
-29.27%
jan 1, 1975
7.145
+1.155
19.29%
jan 1, 1976
1.682
-5.463
-76.46%
jan 1, 1977
11.955
+10.273
610.87%
jan 1, 1978
10.641
-1.314
-10.99%
jan 1, 1979
10.858
+0.216
2.03%
jan 1, 1980
7.797
-3.061
-28.19%
jan 1, 1981
-8.36
-16.156
-207.22%
jan 1, 1982
6.838
+15.198
-181.8%
jan 1, 1983
-1.306
-8.145
-119.1%
jan 1, 1984
3.8
+5.107
-390.88%
jan 1, 1985
7.702
+3.902
102.68%
jan 1, 1986
3.575
-4.127
-53.59%
jan 1, 1987
1.684
-1.891
-52.9%
jan 1, 1988
4.114
+2.43
144.32%
jan 1, 1989
5.188
+1.074
26.12%
jan 1, 1990
8.527
+3.339
64.34%
jan 1, 1991
6.196
-2.331
-27.34%
jan 1, 1992
-1.947
-8.143
-131.43%
jan 1, 1993
7.287
+9.234
-474.22%
jan 1, 1994
8.972
+1.685
23.13%
jan 1, 1995
9.627
+0.655
7.3%
jan 1, 1996
12.583
+2.956
30.7%
jan 1, 1997
1.656
-10.927
-86.84%
jan 1, 1998
5.046
+3.39
204.72%
jan 1, 1999
2.731
-2.316
-45.89%
jan 1, 2000
-0.959
-3.69
-135.13%
jan 1, 2001
11.926
+12.885
-1.34K%
jan 1, 2002
2.674
-9.251
-77.57%
jan 1, 2003
-2.793
-5.468
-204.45%
jan 1, 2004
-1.3
+1.494
-53.47%
jan 1, 2005
6.162
+7.461
-574.09%
jan 1, 2006
3.377
-2.785
-45.2%
jan 1, 2007
8.227
+4.851
143.65%
jan 1, 2008
6.175
-2.052
-24.94%
jan 1, 2009
-3.092
-9.267
-150.06%
jan 1, 2010
-18.051
-14.959
483.86%
jan 1, 2011
11.786
+29.836
-165.29%
jan 1, 2012
5.186
-6.6
-56.0%
jan 1, 2013
2.324
-2.862
-55.19%
jan 1, 2014
0.701
-1.623
-69.85%
jan 1, 2015
2.873
+2.172
309.96%
jan 1, 2016
4.252
+1.379
47.99%
Ranking of countries by current statistics by years


Comments: