29
/
en
AIzaSyAYiBZKx7MnpbEhh9jyipgxe19OcubqV5w
April 1, 2024
24844
Caribbean small states
CSS
false
2
1
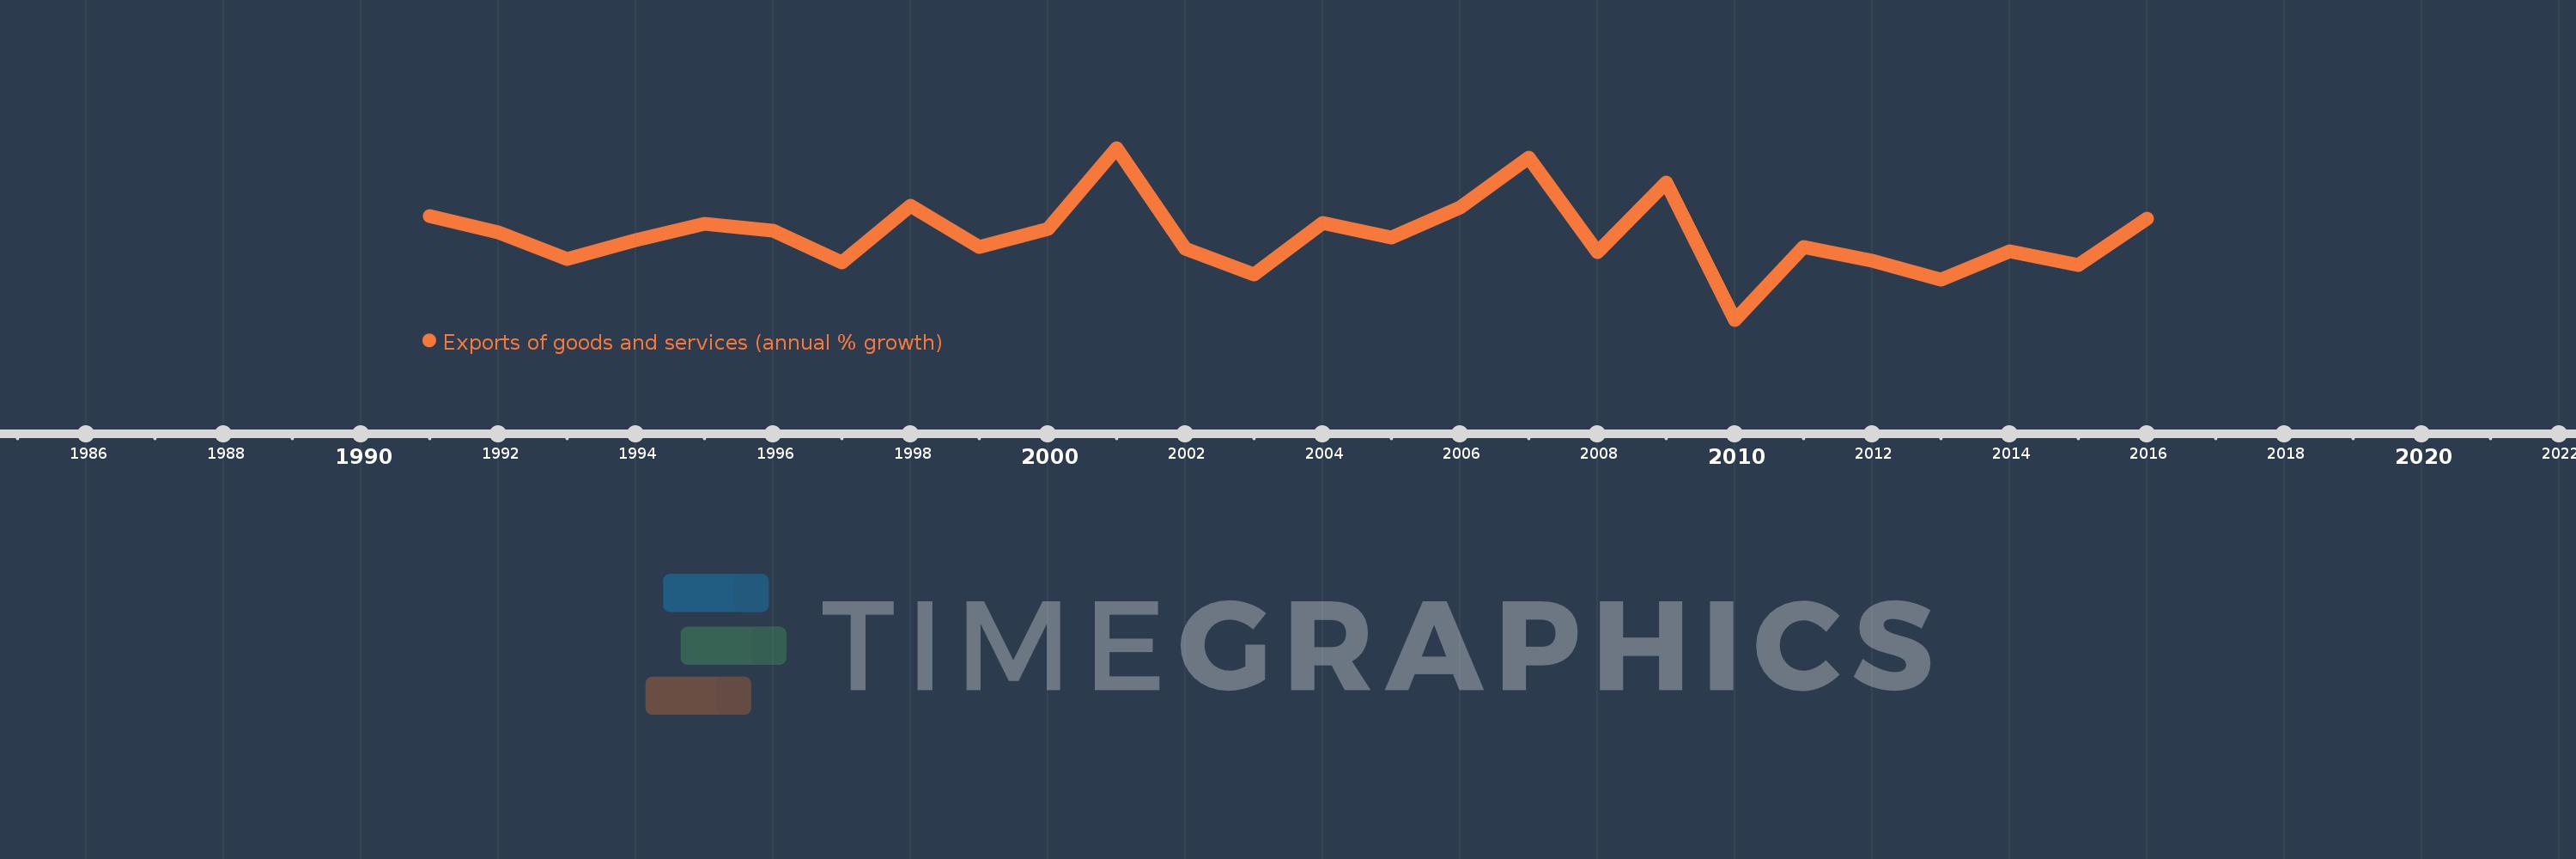
Exports of goods and services (annual % growth)
2016,2015,2014,2013,2012,2011,2010,2009,2008,2007,2006,2005,2004,2003,2002,2001,2000,1999,1998,1997,1996,1995,1994,1993,1992,1991
This statistics in other country:
AlbaniaAlgeriaAngolaAntigua and BarbudaArab WorldArgentinaArmeniaAustraliaAustriaAzerbaijanBahamas, TheBahrainBangladeshBarbadosBelarusBelgiumBelizeBeninBhutanBoliviaBosnia and HerzegovinaBotswanaBrazilBrunei DarussalamBulgariaBurkina FasoBurundiCabo VerdeCambodiaCameroonCanadaCaribbean small statesCentral Europe and the BalticsChadChileColombiaComorosCongo, Dem. Rep.Congo, Rep.Costa RicaCote d'IvoireCroatiaCubaCyprusCzech RepublicDenmarkDjiboutiDominican RepublicEarly-demographic dividendEast Asia & PacificEcuadorEgypt, Arab Rep.El SalvadorEquatorial GuineaEritreaEstoniaEthiopiaEuro areaEurope & Central AsiaEurope & Central Asia (excluding high income)Europe & Central Asia (IDA & IBRD countries)European UnionFijiFinlandFranceGabonGambia, TheGeorgiaGermanyGhanaGreeceGuatemalaGuineaGuinea-BissauHaitiHeavily indebted poor countries (HIPC)High incomeHondurasHong Kong SAR, ChinaHungaryIBRD onlyIcelandIDA & IBRD totalIDA blendIDA onlyIDA totalIndiaIndonesiaIran, Islamic Rep.IrelandIsraelItalyJamaicaJapanJordanKazakhstanKenyaKorea, Rep.KosovoKuwaitKyrgyz RepublicLao PDRLatin America & Caribbean Latin America & Caribbean (excluding high income)Latin America & the Caribbean (IDA & IBRD countries)LatviaLebanonLiberiaLibyaLithuaniaLow & middle incomeLow incomeLower middle incomeLuxembourgMacao SAR, ChinaMacedonia, FYRMadagascarMalawiMalaysiaMaliMaltaMauritaniaMauritiusMexicoMiddle East & North AfricaMiddle East & North Africa (excluding high income)Middle East & North Africa (IDA & IBRD countries)Middle incomeMoldovaMongoliaMontenegroMoroccoMozambiqueMyanmarNamibiaNepalNetherlandsNew ZealandNicaraguaNigerNigeriaNorth AmericaNorwayOECD membersOmanOther small statesPakistanPanamaPapua New GuineaParaguayPeruPhilippinesPolandPortugalPost-demographic dividendPre-demographic dividendPuerto RicoQatarRomaniaRussian FederationRwandaSamoaSaudi ArabiaSenegalSerbiaSeychellesSierra LeoneSingaporeSlovak RepublicSloveniaSmall statesSomaliaSouth AfricaSouth AsiaSouth Asia (IDA & IBRD)South SudanSpainSri LankaSub-Saharan Africa Sub-Saharan Africa (excluding high income)Sub-Saharan Africa (IDA & IBRD countries)SudanSurinameSwazilandSwedenSwitzerlandSyrian Arab RepublicTajikistanTanzaniaThailandTimor-LesteTogoTrinidad and TobagoTunisiaTurkeyTurkmenistanUgandaUkraineUnited Arab EmiratesUnited KingdomUnited StatesUruguayUzbekistanVanuatuVenezuela, RBVietnamWest Bank and GazaWorldZambiaZimbabwe Timeline:
This timeline shows a graph from 1991 to 2016 of Caribbean small states. No data until 1990. Number of actual observations by date: 26.
Source name:
World Development Indicators
Source organization:
World Bank national accounts data, and OECD National Accounts data files.
Categories, topics:
Economy & Growth, Trade
Last updated:
apr 23, 2017
Indicators value changes by year
Minimum:
-15.659
jan 1, 2010
Maximum:
24.357
jan 1, 2001
At the date of observation
Value
Absolute change
Change from previous value
jan 1, 1991
8.579
+8.579
0.0%
jan 1, 1992
4.779
-3.8
-44.29%
jan 1, 1993
-1.483
-6.262
-131.02%
jan 1, 1994
2.925
+4.408
-297.3%
jan 1, 1995
6.661
+3.735
127.69%
jan 1, 1996
5.082
-1.579
-23.71%
jan 1, 1997
-2.267
-7.348
-144.61%
jan 1, 1998
10.839
+13.106
-578.17%
jan 1, 1999
1.229
-9.61
-88.66%
jan 1, 2000
5.41
+4.181
340.2%
jan 1, 2001
24.357
+18.948
350.27%
jan 1, 2002
0.854
-23.503
-96.49%
jan 1, 2003
-5.08
-5.934
-694.8%
jan 1, 2004
6.959
+12.039
-237.0%
jan 1, 2005
3.5
-3.459
-49.7%
jan 1, 2006
10.405
+6.905
197.25%
jan 1, 2007
22.044
+11.639
111.86%
jan 1, 2008
0.013
-22.032
-99.94%
jan 1, 2009
16.34
+16.327
126.03K%
jan 1, 2010
-15.659
-31.999
-195.83%
jan 1, 2011
1.366
+17.025
-108.72%
jan 1, 2012
-1.824
-3.189
-233.56%
jan 1, 2013
-6.298
-4.474
245.31%
jan 1, 2014
0.205
+6.503
-103.26%
jan 1, 2015
-2.887
-3.092
-1.51K%
jan 1, 2016
7.858
+10.745
-372.17%
Ranking of countries by current statistics by years


Comments: