29
/
en
AIzaSyAYiBZKx7MnpbEhh9jyipgxe19OcubqV5w
April 1, 2024
84016
Benin
BEN
true
2
1
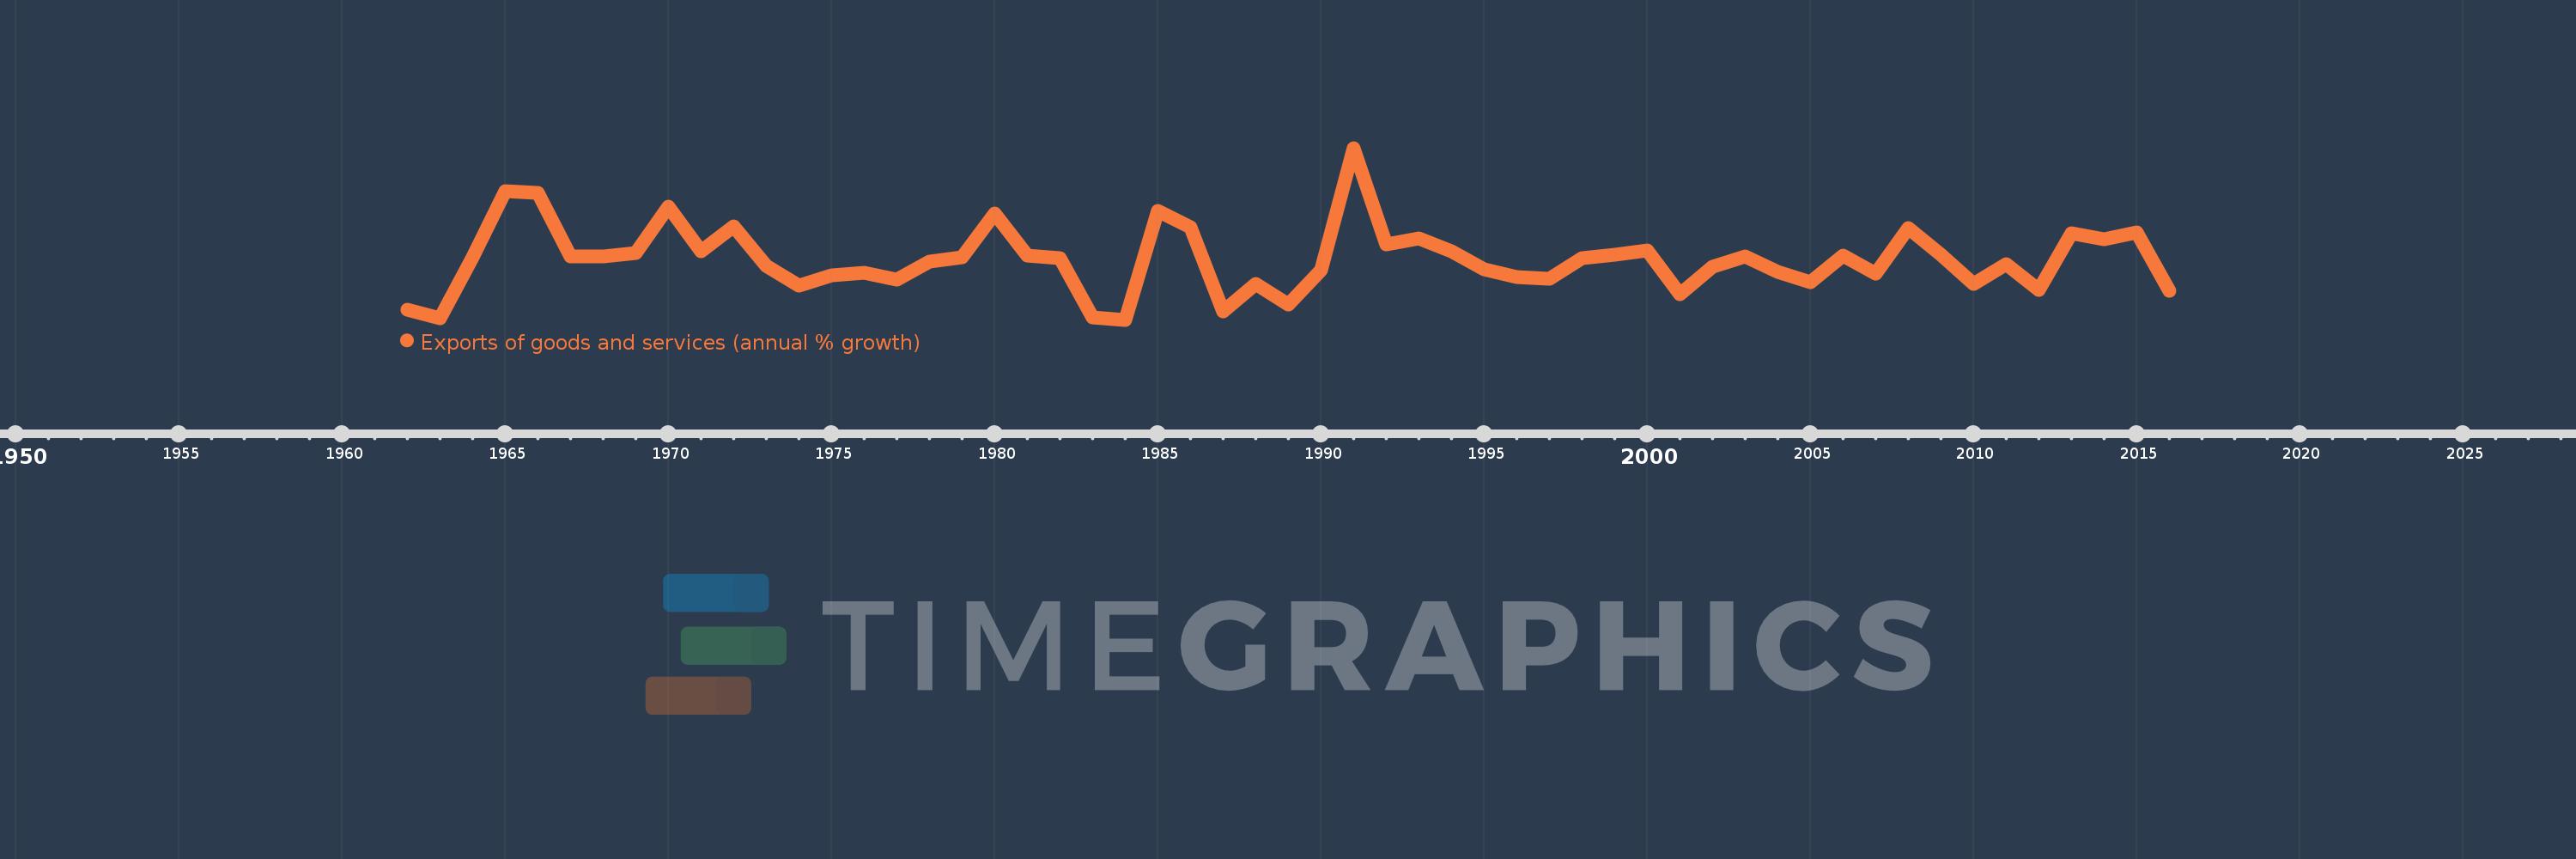
Exports of goods and services (annual % growth)
2016,2015,2014,2013,2012,2011,2010,2009,2008,2007,2006,2005,2004,2003,2002,2001,2000,1999,1998,1997,1996,1995,1994,1993,1992,1991,1990,1989,1988,1987,1986,1985,1984,1983,1982,1981,1980,1979,1978,1977,1976,1975,1974,1973,1972,1971,1970,1969,1968,1967,1966,1965,1964,1963,1962
This statistics in other country:
AlbaniaAlgeriaAngolaAntigua and BarbudaArab WorldArgentinaArmeniaAustraliaAustriaAzerbaijanBahamas, TheBahrainBangladeshBarbadosBelarusBelgiumBelizeBeninBhutanBoliviaBosnia and HerzegovinaBotswanaBrazilBrunei DarussalamBulgariaBurkina FasoBurundiCabo VerdeCambodiaCameroonCanadaCaribbean small statesCentral Europe and the BalticsChadChileColombiaComorosCongo, Dem. Rep.Congo, Rep.Costa RicaCote d'IvoireCroatiaCubaCyprusCzech RepublicDenmarkDjiboutiDominican RepublicEarly-demographic dividendEast Asia & PacificEcuadorEgypt, Arab Rep.El SalvadorEquatorial GuineaEritreaEstoniaEthiopiaEuro areaEurope & Central AsiaEurope & Central Asia (excluding high income)Europe & Central Asia (IDA & IBRD countries)European UnionFijiFinlandFranceGabonGambia, TheGeorgiaGermanyGhanaGreeceGuatemalaGuineaGuinea-BissauHaitiHeavily indebted poor countries (HIPC)High incomeHondurasHong Kong SAR, ChinaHungaryIBRD onlyIcelandIDA & IBRD totalIDA blendIDA onlyIDA totalIndiaIndonesiaIran, Islamic Rep.IrelandIsraelItalyJamaicaJapanJordanKazakhstanKenyaKorea, Rep.KosovoKuwaitKyrgyz RepublicLao PDRLatin America & Caribbean Latin America & Caribbean (excluding high income)Latin America & the Caribbean (IDA & IBRD countries)LatviaLebanonLiberiaLibyaLithuaniaLow & middle incomeLow incomeLower middle incomeLuxembourgMacao SAR, ChinaMacedonia, FYRMadagascarMalawiMalaysiaMaliMaltaMauritaniaMauritiusMexicoMiddle East & North AfricaMiddle East & North Africa (excluding high income)Middle East & North Africa (IDA & IBRD countries)Middle incomeMoldovaMongoliaMontenegroMoroccoMozambiqueMyanmarNamibiaNepalNetherlandsNew ZealandNicaraguaNigerNigeriaNorth AmericaNorwayOECD membersOmanOther small statesPakistanPanamaPapua New GuineaParaguayPeruPhilippinesPolandPortugalPost-demographic dividendPre-demographic dividendPuerto RicoQatarRomaniaRussian FederationRwandaSamoaSaudi ArabiaSenegalSerbiaSeychellesSierra LeoneSingaporeSlovak RepublicSloveniaSmall statesSomaliaSouth AfricaSouth AsiaSouth Asia (IDA & IBRD)South SudanSpainSri LankaSub-Saharan Africa Sub-Saharan Africa (excluding high income)Sub-Saharan Africa (IDA & IBRD countries)SudanSurinameSwazilandSwedenSwitzerlandSyrian Arab RepublicTajikistanTanzaniaThailandTimor-LesteTogoTrinidad and TobagoTunisiaTurkeyTurkmenistanUgandaUkraineUnited Arab EmiratesUnited KingdomUnited StatesUruguayUzbekistanVanuatuVenezuela, RBVietnamWest Bank and GazaWorldZambiaZimbabwe Timeline:
This timeline shows a graph from 1962 to 2016 of Benin. No data until 1961. Number of actual observations by date: 55.
Source name:
World Development Indicators
Source organization:
World Bank national accounts data, and OECD National Accounts data files.
Categories, topics:
Economy & Growth, Trade
Last updated:
apr 23, 2017
Indicators value changes by year
Minimum:
-27.459
jan 1, 1984
Maximum:
74.942
jan 1, 1991
At the date of observation
Value
Absolute change
Change from previous value
jan 1, 1962
-21.698
-21.698
0.0%
jan 1, 1963
-26.506
-4.808
22.16%
jan 1, 1964
9.836
+36.342
-137.11%
jan 1, 1965
49.253
+39.417
400.73%
jan 1, 1966
48.005
-1.249
-2.54%
jan 1, 1967
10.135
-37.869
-78.89%
jan 1, 1968
10.429
+0.294
2.9%
jan 1, 1969
12.222
+1.793
17.19%
jan 1, 1970
40.099
+27.877
228.08%
jan 1, 1971
13.427
-26.672
-66.51%
jan 1, 1972
28.037
+14.61
108.81%
jan 1, 1973
4.672
-23.365
-83.34%
jan 1, 1974
-7.009
-11.681
-250.0%
jan 1, 1975
-0.92
+6.089
-86.88%
jan 1, 1976
0.657
+1.577
-171.4%
jan 1, 1977
-3.576
-4.233
-644.57%
jan 1, 1978
7.068
+10.645
-297.63%
jan 1, 1979
9.673
+2.605
36.85%
jan 1, 1980
35.897
+26.224
271.11%
jan 1, 1981
10.846
-25.051
-69.79%
jan 1, 1982
9.192
-1.654
-15.25%
jan 1, 1983
-25.904
-35.096
-381.82%
jan 1, 1984
-27.459
-1.554
6.0%
jan 1, 1985
37.202
+64.66
-235.48%
jan 1, 1986
27.668
-9.534
-25.63%
jan 1, 1987
-22.39
-50.058
-180.92%
jan 1, 1988
-6.223
+16.166
-72.2%
jan 1, 1989
-18.204
-11.981
192.52%
jan 1, 1990
1.955
+20.159
-110.74%
jan 1, 1991
74.942
+72.987
3.73K%
jan 1, 1992
17.294
-57.648
-76.92%
jan 1, 1993
20.978
+3.684
21.3%
jan 1, 1994
13.496
-7.482
-35.66%
jan 1, 1995
2.449
-11.047
-81.85%
jan 1, 1996
-1.758
-4.207
-171.76%
jan 1, 1997
-2.783
-1.025
58.31%
jan 1, 1998
9.463
+12.245
-440.09%
jan 1, 1999
11.086
+1.623
17.15%
jan 1, 2000
13.788
+2.703
24.38%
jan 1, 2001
-12.384
-26.172
-189.81%
jan 1, 2002
3.877
+16.261
-131.3%
jan 1, 2003
10.524
+6.647
171.46%
jan 1, 2004
1.279
-9.245
-87.84%
jan 1, 2005
-4.991
-6.27
-490.09%
jan 1, 2006
10.767
+15.758
-315.75%
jan 1, 2007
-0.138
-10.905
-101.28%
jan 1, 2008
27.33
+27.468
-19.94K%
jan 1, 2009
11.266
-16.064
-58.78%
jan 1, 2010
-6.036
-17.302
-153.58%
jan 1, 2011
5.639
+11.676
-193.43%
jan 1, 2012
-9.668
-15.307
-271.43%
jan 1, 2013
24.089
+33.757
-349.16%
jan 1, 2014
20.738
-3.351
-13.91%
jan 1, 2015
24.816
+4.079
19.67%
jan 1, 2016
-10.061
-34.878
-140.54%
Ranking of countries by current statistics by years


Comments: