29
/
en
AIzaSyAYiBZKx7MnpbEhh9jyipgxe19OcubqV5w
April 1, 2024
126104
El Salvador
SLV
true
2
1
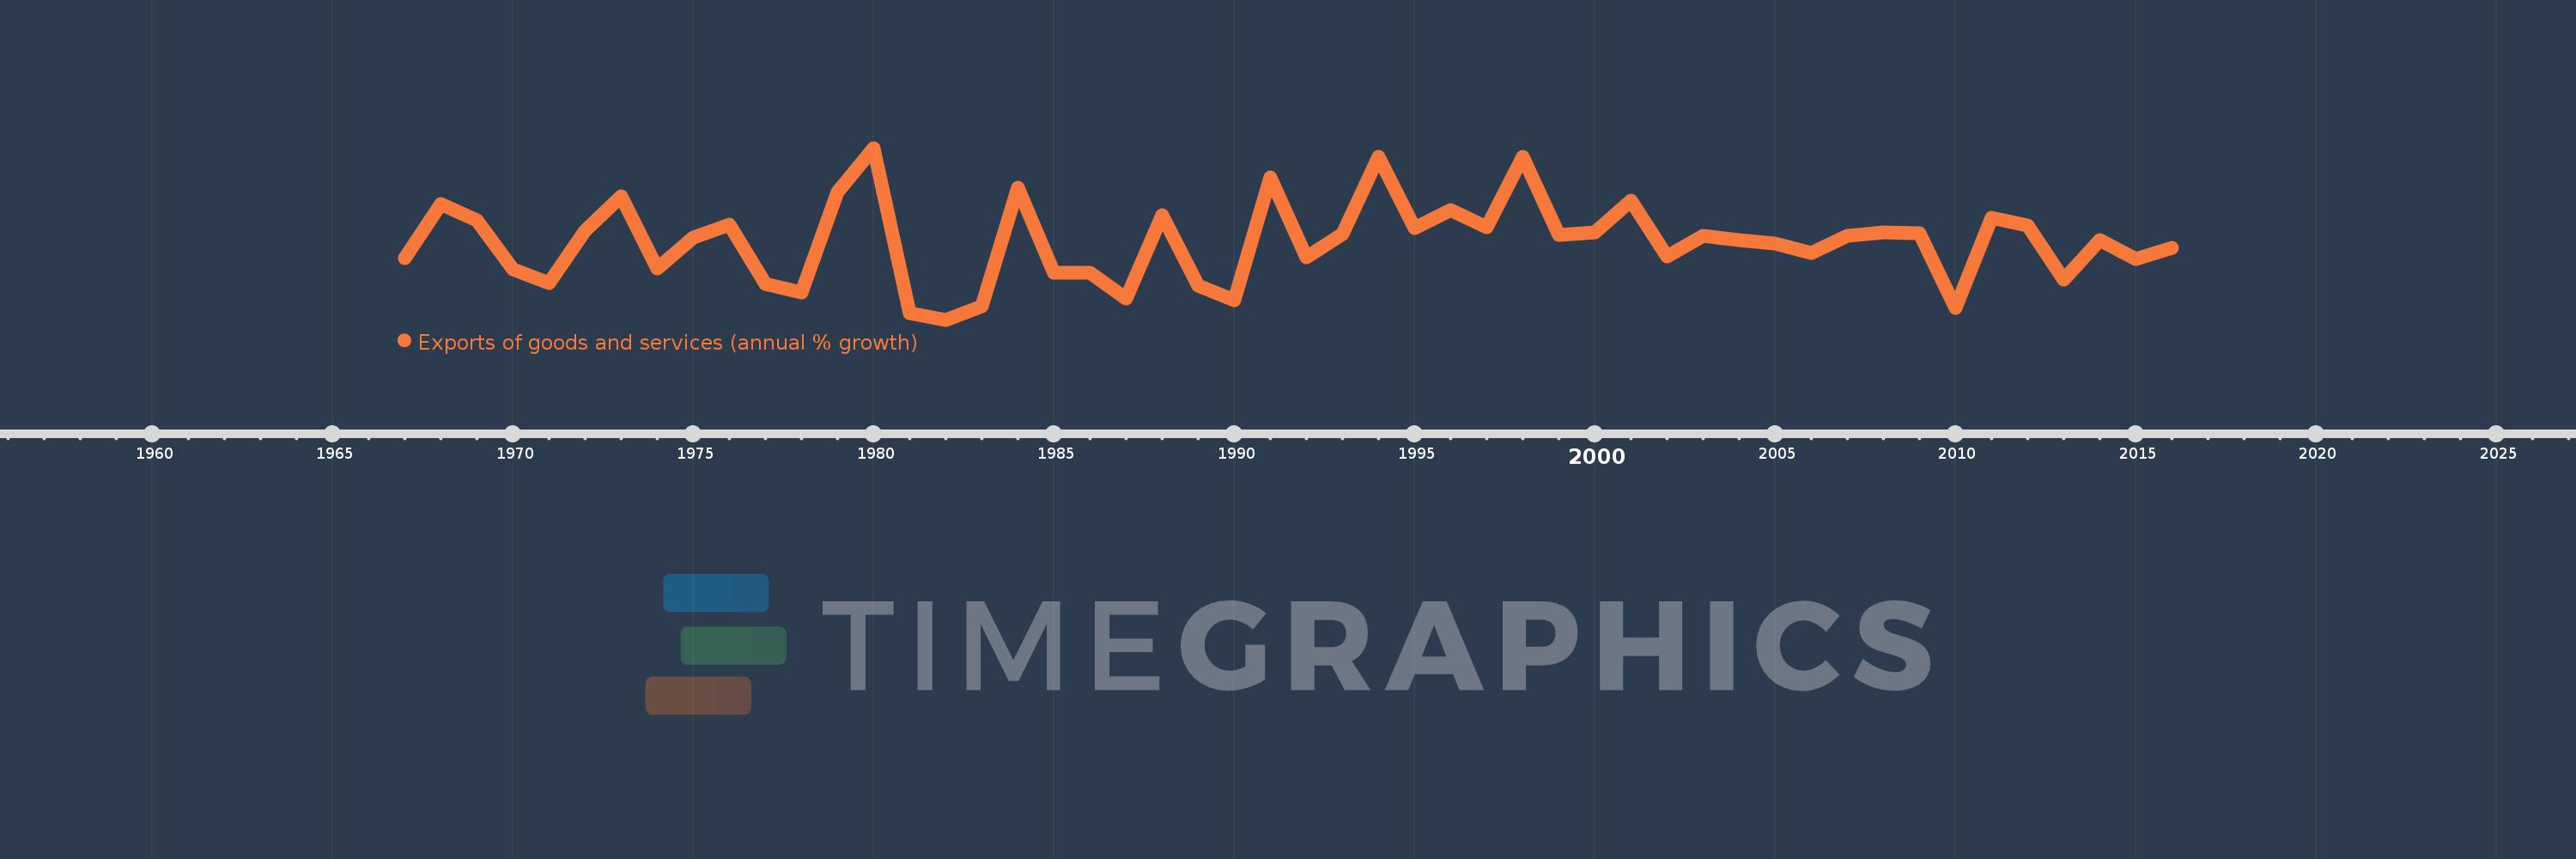
Exports of goods and services (annual % growth)
2016,2015,2014,2013,2012,2011,2010,2009,2008,2007,2006,2005,2004,2003,2002,2001,2000,1999,1998,1997,1996,1995,1994,1993,1992,1991,1990,1989,1988,1987,1986,1985,1984,1983,1982,1981,1980,1979,1978,1977,1976,1975,1974,1973,1972,1971,1970,1969,1968,1967
This statistics in other country:
AlbaniaAlgeriaAngolaAntigua and BarbudaArab WorldArgentinaArmeniaAustraliaAustriaAzerbaijanBahamas, TheBahrainBangladeshBarbadosBelarusBelgiumBelizeBeninBhutanBoliviaBosnia and HerzegovinaBotswanaBrazilBrunei DarussalamBulgariaBurkina FasoBurundiCabo VerdeCambodiaCameroonCanadaCaribbean small statesCentral Europe and the BalticsChadChileColombiaComorosCongo, Dem. Rep.Congo, Rep.Costa RicaCote d'IvoireCroatiaCubaCyprusCzech RepublicDenmarkDjiboutiDominican RepublicEarly-demographic dividendEast Asia & PacificEcuadorEgypt, Arab Rep.El SalvadorEquatorial GuineaEritreaEstoniaEthiopiaEuro areaEurope & Central AsiaEurope & Central Asia (excluding high income)Europe & Central Asia (IDA & IBRD countries)European UnionFijiFinlandFranceGabonGambia, TheGeorgiaGermanyGhanaGreeceGuatemalaGuineaGuinea-BissauHaitiHeavily indebted poor countries (HIPC)High incomeHondurasHong Kong SAR, ChinaHungaryIBRD onlyIcelandIDA & IBRD totalIDA blendIDA onlyIDA totalIndiaIndonesiaIran, Islamic Rep.IrelandIsraelItalyJamaicaJapanJordanKazakhstanKenyaKorea, Rep.KosovoKuwaitKyrgyz RepublicLao PDRLatin America & Caribbean Latin America & Caribbean (excluding high income)Latin America & the Caribbean (IDA & IBRD countries)LatviaLebanonLiberiaLibyaLithuaniaLow & middle incomeLow incomeLower middle incomeLuxembourgMacao SAR, ChinaMacedonia, FYRMadagascarMalawiMalaysiaMaliMaltaMauritaniaMauritiusMexicoMiddle East & North AfricaMiddle East & North Africa (excluding high income)Middle East & North Africa (IDA & IBRD countries)Middle incomeMoldovaMongoliaMontenegroMoroccoMozambiqueMyanmarNamibiaNepalNetherlandsNew ZealandNicaraguaNigerNigeriaNorth AmericaNorwayOECD membersOmanOther small statesPakistanPanamaPapua New GuineaParaguayPeruPhilippinesPolandPortugalPost-demographic dividendPre-demographic dividendPuerto RicoQatarRomaniaRussian FederationRwandaSamoaSaudi ArabiaSenegalSerbiaSeychellesSierra LeoneSingaporeSlovak RepublicSloveniaSmall statesSomaliaSouth AfricaSouth AsiaSouth Asia (IDA & IBRD)South SudanSpainSri LankaSub-Saharan Africa Sub-Saharan Africa (excluding high income)Sub-Saharan Africa (IDA & IBRD countries)SudanSurinameSwazilandSwedenSwitzerlandSyrian Arab RepublicTajikistanTanzaniaThailandTimor-LesteTogoTrinidad and TobagoTunisiaTurkeyTurkmenistanUgandaUkraineUnited Arab EmiratesUnited KingdomUnited StatesUruguayUzbekistanVanuatuVenezuela, RBVietnamWest Bank and GazaWorldZambiaZimbabwe Timeline:
This timeline shows a graph from 1967 to 2016 of El Salvador. No data until 1966. Number of actual observations by date: 50.
Source name:
World Development Indicators
Source organization:
World Bank national accounts data, and OECD National Accounts data files.
Categories, topics:
Economy & Growth, Trade
Last updated:
apr 23, 2017
Indicators value changes by year
Minimum:
-19.52
jan 1, 1982
Maximum:
32.749
jan 1, 1980
At the date of observation
Value
Absolute change
Change from previous value
jan 1, 1967
-0.703
-0.703
0.0%
jan 1, 1968
15.769
+16.472
-2.34K%
jan 1, 1969
10.703
-5.065
-32.12%
jan 1, 1970
-4.05
-14.754
-137.84%
jan 1, 1971
-8.405
-4.354
107.5%
jan 1, 1972
7.679
+16.084
-191.36%
jan 1, 1973
17.94
+10.261
133.63%
jan 1, 1974
-3.983
-21.923
-122.2%
jan 1, 1975
5.548
+9.531
-239.31%
jan 1, 1976
9.285
+3.737
67.35%
jan 1, 1977
-8.517
-17.802
-191.73%
jan 1, 1978
-11.12
-2.602
30.56%
jan 1, 1979
19.268
+30.388
-273.28%
jan 1, 1980
32.749
+13.481
69.96%
jan 1, 1981
-17.421
-50.17
-153.2%
jan 1, 1982
-19.52
-2.098
12.05%
jan 1, 1983
-15.408
+4.112
-21.06%
jan 1, 1984
20.693
+36.102
-234.3%
jan 1, 1985
-5.214
-25.908
-125.2%
jan 1, 1986
-5.181
+0.034
-0.64%
jan 1, 1987
-12.989
-7.809
150.74%
jan 1, 1988
12.194
+25.184
-193.88%
jan 1, 1989
-9.163
-21.357
-175.14%
jan 1, 1990
-13.586
-4.423
48.27%
jan 1, 1991
23.888
+37.474
-275.83%
jan 1, 1992
-0.483
-24.371
-102.02%
jan 1, 1993
6.508
+6.991
-1.45K%
jan 1, 1994
30.128
+23.62
362.94%
jan 1, 1995
8.439
-21.689
-71.99%
jan 1, 1996
13.906
+5.467
64.78%
jan 1, 1997
8.67
-5.236
-37.65%
jan 1, 1998
30.181
+21.51
248.09%
jan 1, 1999
6.245
-23.935
-79.31%
jan 1, 2000
7.132
+0.887
14.2%
jan 1, 2001
16.796
+9.664
135.51%
jan 1, 2002
-0.203
-16.999
-101.21%
jan 1, 2003
5.989
+6.192
-3.05K%
jan 1, 2004
4.673
-1.315
-21.97%
jan 1, 2005
3.594
-1.079
-23.08%
jan 1, 2006
0.901
-2.693
-74.93%
jan 1, 2007
5.885
+4.984
553.1%
jan 1, 2008
7.084
+1.2
20.38%
jan 1, 2009
6.864
-0.22
-3.11%
jan 1, 2010
-15.969
-22.833
-332.65%
jan 1, 2011
11.613
+27.581
-172.72%
jan 1, 2012
9.28
-2.332
-20.08%
jan 1, 2013
-7.332
-16.612
-179.01%
jan 1, 2014
4.827
+12.159
-165.83%
jan 1, 2015
-0.948
-5.775
-119.65%
jan 1, 2016
2.404
+3.353
-353.46%
Ranking of countries by current statistics by years


Comments: