29
/
en
AIzaSyAYiBZKx7MnpbEhh9jyipgxe19OcubqV5w
April 1, 2024
43381
Latin America & the Caribbean (IDA & IBRD countries)
TLA
false
2
1
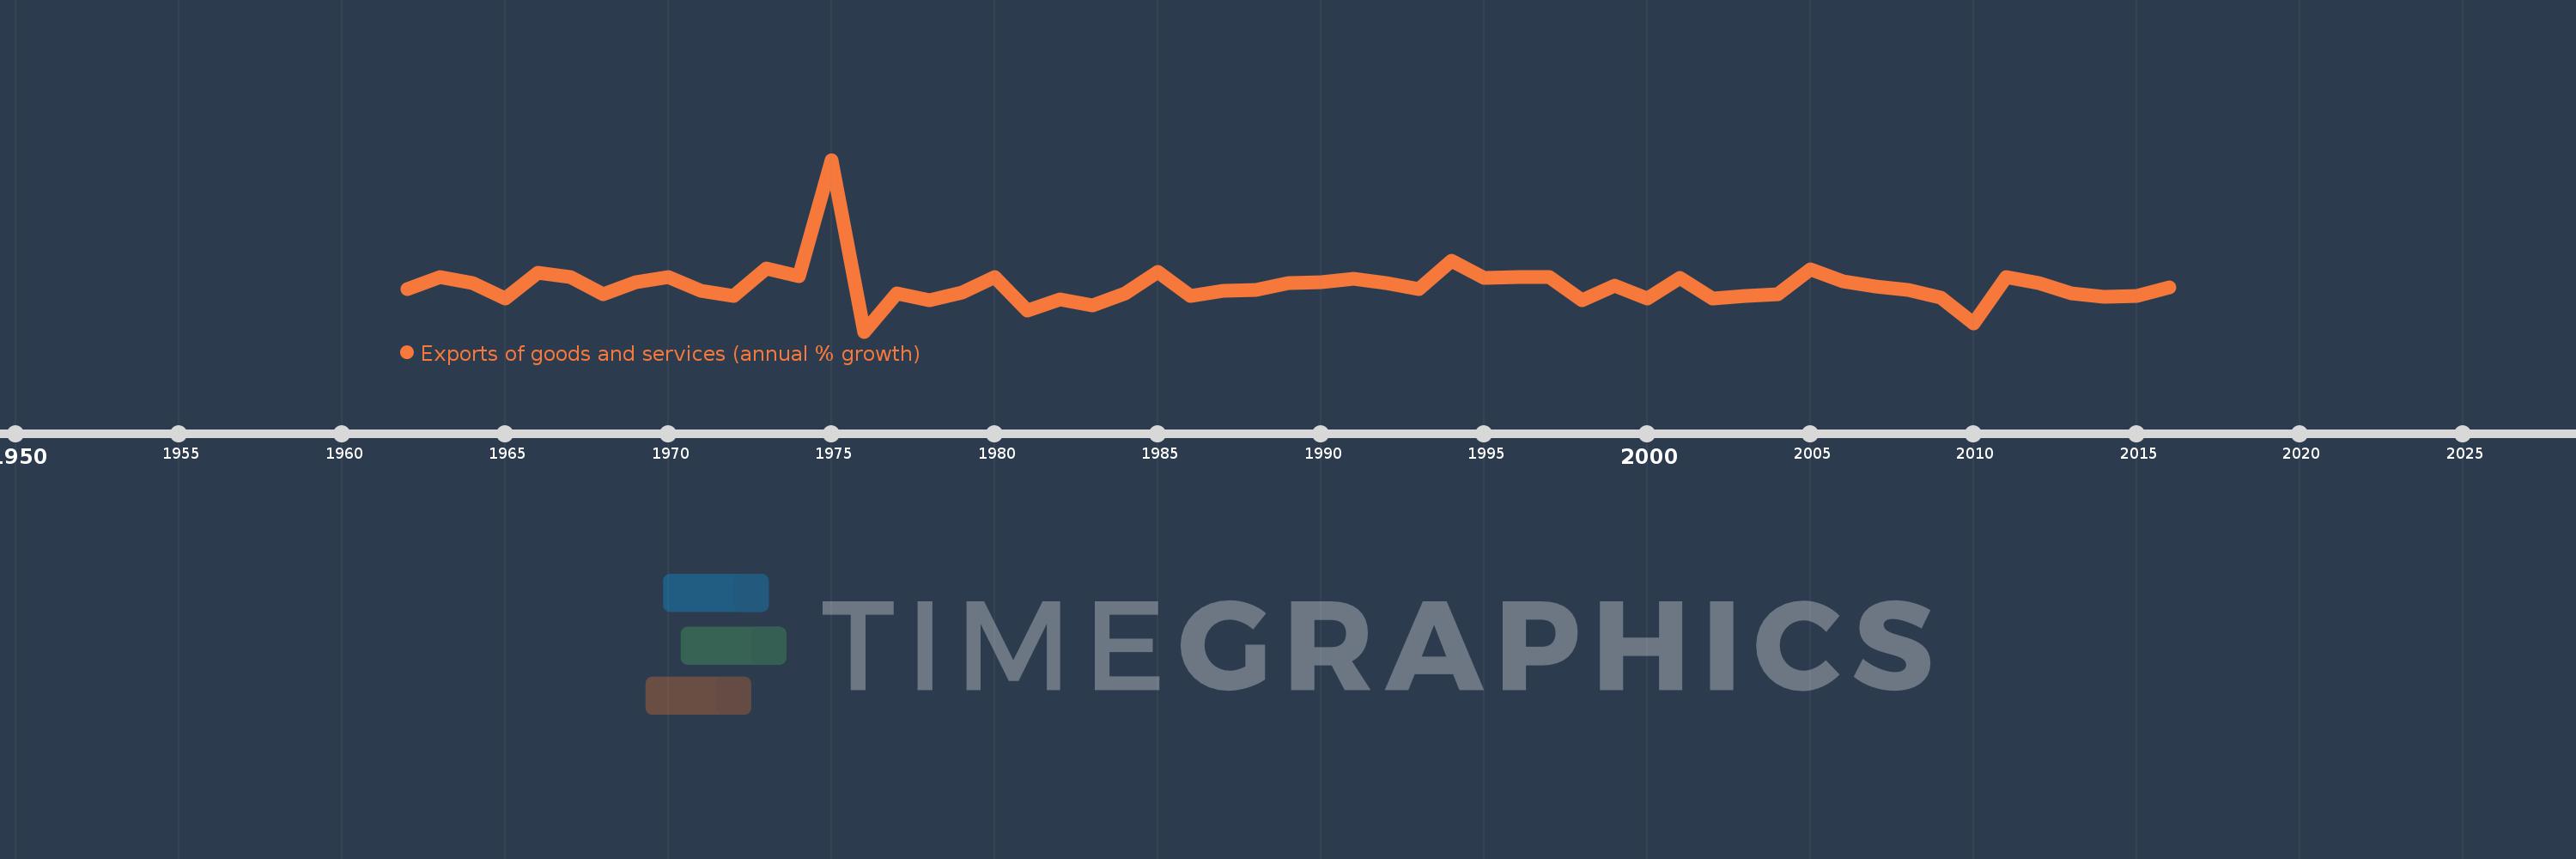
Exports of goods and services (annual % growth)
2016,2015,2014,2013,2012,2011,2010,2009,2008,2007,2006,2005,2004,2003,2002,2001,2000,1999,1998,1997,1996,1995,1994,1993,1992,1991,1990,1989,1988,1987,1986,1985,1984,1983,1982,1981,1980,1979,1978,1977,1976,1975,1974,1973,1972,1971,1970,1969,1968,1967,1966,1965,1964,1963,1962
This statistics in other country:
AlbaniaAlgeriaAngolaAntigua and BarbudaArab WorldArgentinaArmeniaAustraliaAustriaAzerbaijanBahamas, TheBahrainBangladeshBarbadosBelarusBelgiumBelizeBeninBhutanBoliviaBosnia and HerzegovinaBotswanaBrazilBrunei DarussalamBulgariaBurkina FasoBurundiCabo VerdeCambodiaCameroonCanadaCaribbean small statesCentral Europe and the BalticsChadChileColombiaComorosCongo, Dem. Rep.Congo, Rep.Costa RicaCote d'IvoireCroatiaCubaCyprusCzech RepublicDenmarkDjiboutiDominican RepublicEarly-demographic dividendEast Asia & PacificEcuadorEgypt, Arab Rep.El SalvadorEquatorial GuineaEritreaEstoniaEthiopiaEuro areaEurope & Central AsiaEurope & Central Asia (excluding high income)Europe & Central Asia (IDA & IBRD countries)European UnionFijiFinlandFranceGabonGambia, TheGeorgiaGermanyGhanaGreeceGuatemalaGuineaGuinea-BissauHaitiHeavily indebted poor countries (HIPC)High incomeHondurasHong Kong SAR, ChinaHungaryIBRD onlyIcelandIDA & IBRD totalIDA blendIDA onlyIDA totalIndiaIndonesiaIran, Islamic Rep.IrelandIsraelItalyJamaicaJapanJordanKazakhstanKenyaKorea, Rep.KosovoKuwaitKyrgyz RepublicLao PDRLatin America & Caribbean Latin America & Caribbean (excluding high income)Latin America & the Caribbean (IDA & IBRD countries)LatviaLebanonLiberiaLibyaLithuaniaLow & middle incomeLow incomeLower middle incomeLuxembourgMacao SAR, ChinaMacedonia, FYRMadagascarMalawiMalaysiaMaliMaltaMauritaniaMauritiusMexicoMiddle East & North AfricaMiddle East & North Africa (excluding high income)Middle East & North Africa (IDA & IBRD countries)Middle incomeMoldovaMongoliaMontenegroMoroccoMozambiqueMyanmarNamibiaNepalNetherlandsNew ZealandNicaraguaNigerNigeriaNorth AmericaNorwayOECD membersOmanOther small statesPakistanPanamaPapua New GuineaParaguayPeruPhilippinesPolandPortugalPost-demographic dividendPre-demographic dividendPuerto RicoQatarRomaniaRussian FederationRwandaSamoaSaudi ArabiaSenegalSerbiaSeychellesSierra LeoneSingaporeSlovak RepublicSloveniaSmall statesSomaliaSouth AfricaSouth AsiaSouth Asia (IDA & IBRD)South SudanSpainSri LankaSub-Saharan Africa Sub-Saharan Africa (excluding high income)Sub-Saharan Africa (IDA & IBRD countries)SudanSurinameSwazilandSwedenSwitzerlandSyrian Arab RepublicTajikistanTanzaniaThailandTimor-LesteTogoTrinidad and TobagoTunisiaTurkeyTurkmenistanUgandaUkraineUnited Arab EmiratesUnited KingdomUnited StatesUruguayUzbekistanVanuatuVenezuela, RBVietnamWest Bank and GazaWorldZambiaZimbabwe Timeline:
This timeline shows a graph from 1962 to 2016 of Latin America & the Caribbean (IDA & IBRD countries). No data until 1961. Number of actual observations by date: 55.
Source name:
World Development Indicators
Source organization:
World Bank national accounts data, and OECD National Accounts data files.
Categories, topics:
Economy & Growth, Trade
Last updated:
apr 23, 2017
Indicators value changes by year
Minimum:
-12.63
jan 1, 1976
Maximum:
55.142
jan 1, 1975
At the date of observation
Value
Absolute change
Change from previous value
jan 1, 1962
4.073
+4.073
0.0%
jan 1, 1963
8.899
+4.827
118.51%
jan 1, 1964
6.354
-2.546
-28.61%
jan 1, 1965
0.247
-6.107
-96.12%
jan 1, 1966
10.601
+10.355
4.2K%
jan 1, 1967
8.805
-1.796
-16.95%
jan 1, 1968
2.25
-6.555
-74.45%
jan 1, 1969
6.837
+4.587
203.85%
jan 1, 1970
8.757
+1.92
28.09%
jan 1, 1971
3.616
-5.141
-58.71%
jan 1, 1972
1.498
-2.118
-58.58%
jan 1, 1973
12.283
+10.785
719.99%
jan 1, 1974
9.128
-3.155
-25.69%
jan 1, 1975
55.142
+46.014
504.12%
jan 1, 1976
-12.63
-67.772
-122.9%
jan 1, 1977
2.395
+15.025
-118.96%
jan 1, 1978
-0.368
-2.763
-115.36%
jan 1, 1979
2.769
+3.137
-852.81%
jan 1, 1980
9.021
+6.252
225.79%
jan 1, 1981
-4.182
-13.203
-146.36%
jan 1, 1982
0.129
+4.31
-103.08%
jan 1, 1983
-2.429
-2.557
-1.99K%
jan 1, 1984
2.437
+4.866
-200.35%
jan 1, 1985
10.933
+8.496
348.62%
jan 1, 1986
1.425
-9.508
-86.97%
jan 1, 1987
3.461
+2.037
142.97%
jan 1, 1988
3.927
+0.466
13.46%
jan 1, 1989
6.607
+2.68
68.25%
jan 1, 1990
6.809
+0.202
3.06%
jan 1, 1991
8.051
+1.241
18.23%
jan 1, 1992
6.364
-1.687
-20.95%
jan 1, 1993
4.289
-2.075
-32.61%
jan 1, 1994
15.312
+11.023
257.02%
jan 1, 1995
8.469
-6.843
-44.69%
jan 1, 1996
9.008
+0.539
6.37%
jan 1, 1997
8.752
-0.256
-2.84%
jan 1, 1998
-0.193
-8.946
-102.21%
jan 1, 1999
5.606
+5.799
-3.0K%
jan 1, 2000
0.514
-5.092
-90.83%
jan 1, 2001
8.39
+7.876
1.53K%
jan 1, 2002
0.481
-7.909
-94.27%
jan 1, 2003
1.455
+0.974
202.52%
jan 1, 2004
2.18
+0.725
49.83%
jan 1, 2005
11.815
+9.635
442.08%
jan 1, 2006
7.036
-4.779
-40.45%
jan 1, 2007
5.087
-1.949
-27.7%
jan 1, 2008
3.83
-1.257
-24.7%
jan 1, 2009
0.808
-3.022
-78.9%
jan 1, 2010
-9.479
-10.287
-1.27K%
jan 1, 2011
8.765
+18.244
-192.46%
jan 1, 2012
6.418
-2.346
-26.77%
jan 1, 2013
2.518
-3.901
-60.77%
jan 1, 2014
1.242
-1.275
-50.65%
jan 1, 2015
1.451
+0.208
16.78%
jan 1, 2016
4.906
+3.456
238.17%
Ranking of countries by current statistics by years


Comments: