29
/
en
AIzaSyAYiBZKx7MnpbEhh9jyipgxe19OcubqV5w
April 1, 2024
73856
Austria
AUT
true
2
1
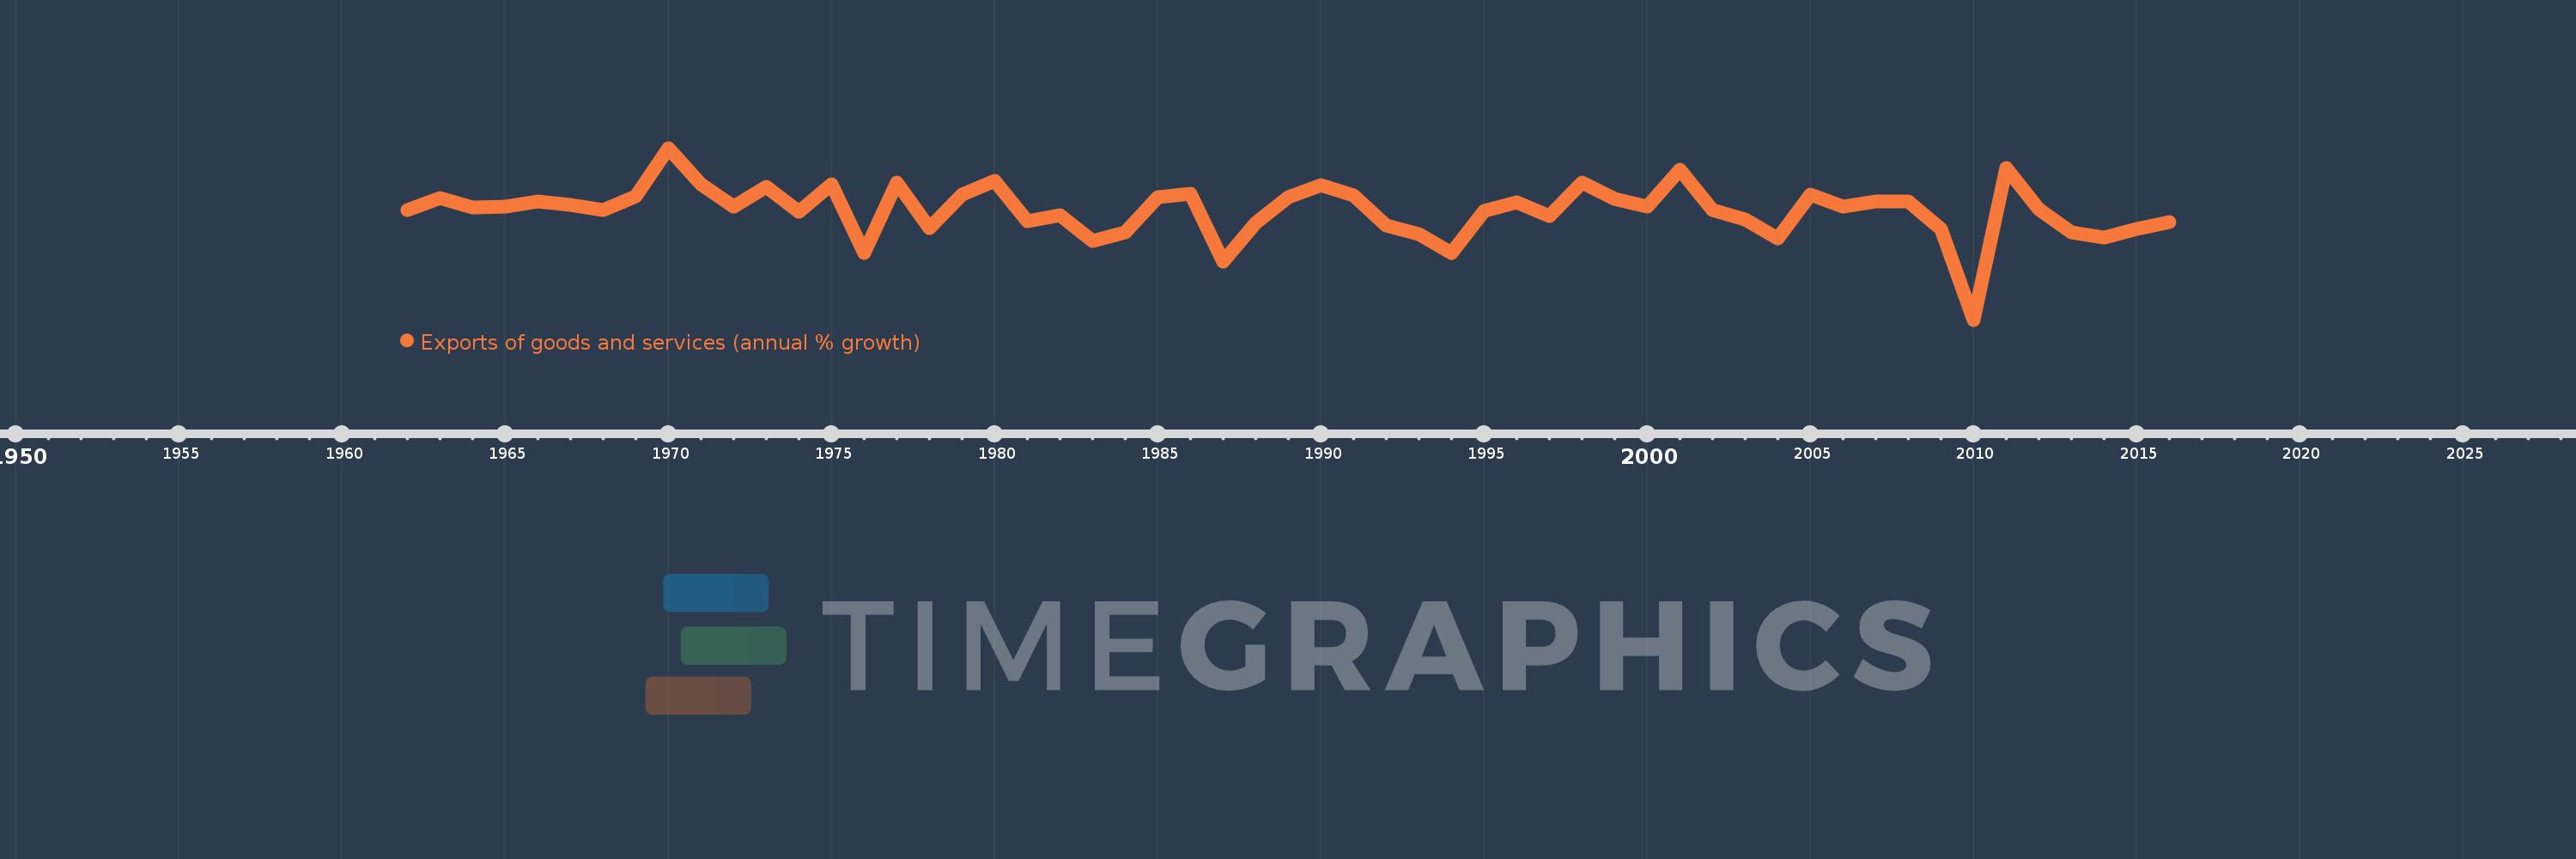
Exports of goods and services (annual % growth)
2016,2015,2014,2013,2012,2011,2010,2009,2008,2007,2006,2005,2004,2003,2002,2001,2000,1999,1998,1997,1996,1995,1994,1993,1992,1991,1990,1989,1988,1987,1986,1985,1984,1983,1982,1981,1980,1979,1978,1977,1976,1975,1974,1973,1972,1971,1970,1969,1968,1967,1966,1965,1964,1963,1962
This statistics in other country:
AlbaniaAlgeriaAngolaAntigua and BarbudaArab WorldArgentinaArmeniaAustraliaAustriaAzerbaijanBahamas, TheBahrainBangladeshBarbadosBelarusBelgiumBelizeBeninBhutanBoliviaBosnia and HerzegovinaBotswanaBrazilBrunei DarussalamBulgariaBurkina FasoBurundiCabo VerdeCambodiaCameroonCanadaCaribbean small statesCentral Europe and the BalticsChadChileColombiaComorosCongo, Dem. Rep.Congo, Rep.Costa RicaCote d'IvoireCroatiaCubaCyprusCzech RepublicDenmarkDjiboutiDominican RepublicEarly-demographic dividendEast Asia & PacificEcuadorEgypt, Arab Rep.El SalvadorEquatorial GuineaEritreaEstoniaEthiopiaEuro areaEurope & Central AsiaEurope & Central Asia (excluding high income)Europe & Central Asia (IDA & IBRD countries)European UnionFijiFinlandFranceGabonGambia, TheGeorgiaGermanyGhanaGreeceGuatemalaGuineaGuinea-BissauHaitiHeavily indebted poor countries (HIPC)High incomeHondurasHong Kong SAR, ChinaHungaryIBRD onlyIcelandIDA & IBRD totalIDA blendIDA onlyIDA totalIndiaIndonesiaIran, Islamic Rep.IrelandIsraelItalyJamaicaJapanJordanKazakhstanKenyaKorea, Rep.KosovoKuwaitKyrgyz RepublicLao PDRLatin America & Caribbean Latin America & Caribbean (excluding high income)Latin America & the Caribbean (IDA & IBRD countries)LatviaLebanonLiberiaLibyaLithuaniaLow & middle incomeLow incomeLower middle incomeLuxembourgMacao SAR, ChinaMacedonia, FYRMadagascarMalawiMalaysiaMaliMaltaMauritaniaMauritiusMexicoMiddle East & North AfricaMiddle East & North Africa (excluding high income)Middle East & North Africa (IDA & IBRD countries)Middle incomeMoldovaMongoliaMontenegroMoroccoMozambiqueMyanmarNamibiaNepalNetherlandsNew ZealandNicaraguaNigerNigeriaNorth AmericaNorwayOECD membersOmanOther small statesPakistanPanamaPapua New GuineaParaguayPeruPhilippinesPolandPortugalPost-demographic dividendPre-demographic dividendPuerto RicoQatarRomaniaRussian FederationRwandaSamoaSaudi ArabiaSenegalSerbiaSeychellesSierra LeoneSingaporeSlovak RepublicSloveniaSmall statesSomaliaSouth AfricaSouth AsiaSouth Asia (IDA & IBRD)South SudanSpainSri LankaSub-Saharan Africa Sub-Saharan Africa (excluding high income)Sub-Saharan Africa (IDA & IBRD countries)SudanSurinameSwazilandSwedenSwitzerlandSyrian Arab RepublicTajikistanTanzaniaThailandTimor-LesteTogoTrinidad and TobagoTunisiaTurkeyTurkmenistanUgandaUkraineUnited Arab EmiratesUnited KingdomUnited StatesUruguayUzbekistanVanuatuVenezuela, RBVietnamWest Bank and GazaWorldZambiaZimbabwe Timeline:
This timeline shows a graph from 1962 to 2016 of Austria. No data until 1961. Number of actual observations by date: 55.
Source name:
World Development Indicators
Source organization:
World Bank national accounts data, and OECD National Accounts data files.
Categories, topics:
Economy & Growth, Trade
Last updated:
apr 23, 2017
Indicators value changes by year
Minimum:
-15.008
jan 1, 2010
Maximum:
17.598
jan 1, 1970
At the date of observation
Value
Absolute change
Change from previous value
jan 1, 1962
5.774
+5.774
0.0%
jan 1, 1963
8.079
+2.305
39.92%
jan 1, 1964
6.263
-1.816
-22.48%
jan 1, 1965
6.464
+0.201
3.21%
jan 1, 1966
7.5
+1.036
16.03%
jan 1, 1967
6.725
-0.775
-10.33%
jan 1, 1968
5.819
-0.906
-13.47%
jan 1, 1969
8.455
+2.635
45.29%
jan 1, 1970
17.598
+9.143
108.14%
jan 1, 1971
10.688
-6.909
-39.26%
jan 1, 1972
6.408
-4.28
-40.05%
jan 1, 1973
10.145
+3.737
58.32%
jan 1, 1974
5.441
-4.704
-46.37%
jan 1, 1975
10.711
+5.27
96.87%
jan 1, 1976
-2.399
-13.11
-122.4%
jan 1, 1977
11.059
+13.459
-560.96%
jan 1, 1978
2.394
-8.665
-78.35%
jan 1, 1979
8.729
+6.334
264.55%
jan 1, 1980
11.324
+2.596
29.74%
jan 1, 1981
3.682
-7.643
-67.49%
jan 1, 1982
4.883
+1.202
32.65%
jan 1, 1983
-0.085
-4.968
-101.74%
jan 1, 1984
1.584
+1.669
-1.97K%
jan 1, 1985
8.32
+6.736
425.29%
jan 1, 1986
8.954
+0.634
7.62%
jan 1, 1987
-4.052
-13.007
-145.25%
jan 1, 1988
3.432
+7.484
-184.69%
jan 1, 1989
8.257
+4.825
140.6%
jan 1, 1990
10.544
+2.287
27.7%
jan 1, 1991
8.572
-1.972
-18.7%
jan 1, 1992
2.937
-5.635
-65.73%
jan 1, 1993
1.319
-1.618
-55.08%
jan 1, 1994
-2.373
-3.693
-279.87%
jan 1, 1995
5.688
+8.061
-339.68%
jan 1, 1996
7.205
+1.517
26.68%
jan 1, 1997
4.638
-2.567
-35.62%
jan 1, 1998
11.028
+6.389
137.75%
jan 1, 1999
7.851
-3.176
-28.8%
jan 1, 2000
6.434
-1.418
-18.05%
jan 1, 2001
13.525
+7.091
110.21%
jan 1, 2002
5.744
-7.781
-57.53%
jan 1, 2003
4.098
-1.646
-28.66%
jan 1, 2004
0.402
-3.696
-90.19%
jan 1, 2005
8.781
+8.38
2.09K%
jan 1, 2006
6.511
-2.27
-25.85%
jan 1, 2007
7.46
+0.949
14.57%
jan 1, 2008
7.386
-0.074
-0.99%
jan 1, 2009
2.259
-5.127
-69.42%
jan 1, 2010
-15.008
-17.266
-764.37%
jan 1, 2011
13.84
+28.848
-192.22%
jan 1, 2012
5.973
-7.867
-56.84%
jan 1, 2013
1.651
-4.322
-72.36%
jan 1, 2014
0.539
-1.112
-67.34%
jan 1, 2015
2.28
+1.741
322.88%
jan 1, 2016
3.558
+1.279
56.09%
Ranking of countries by current statistics by years


Comments: