29
/
en
AIzaSyAYiBZKx7MnpbEhh9jyipgxe19OcubqV5w
April 1, 2024
29813
Euro area
EMU
false
2
1
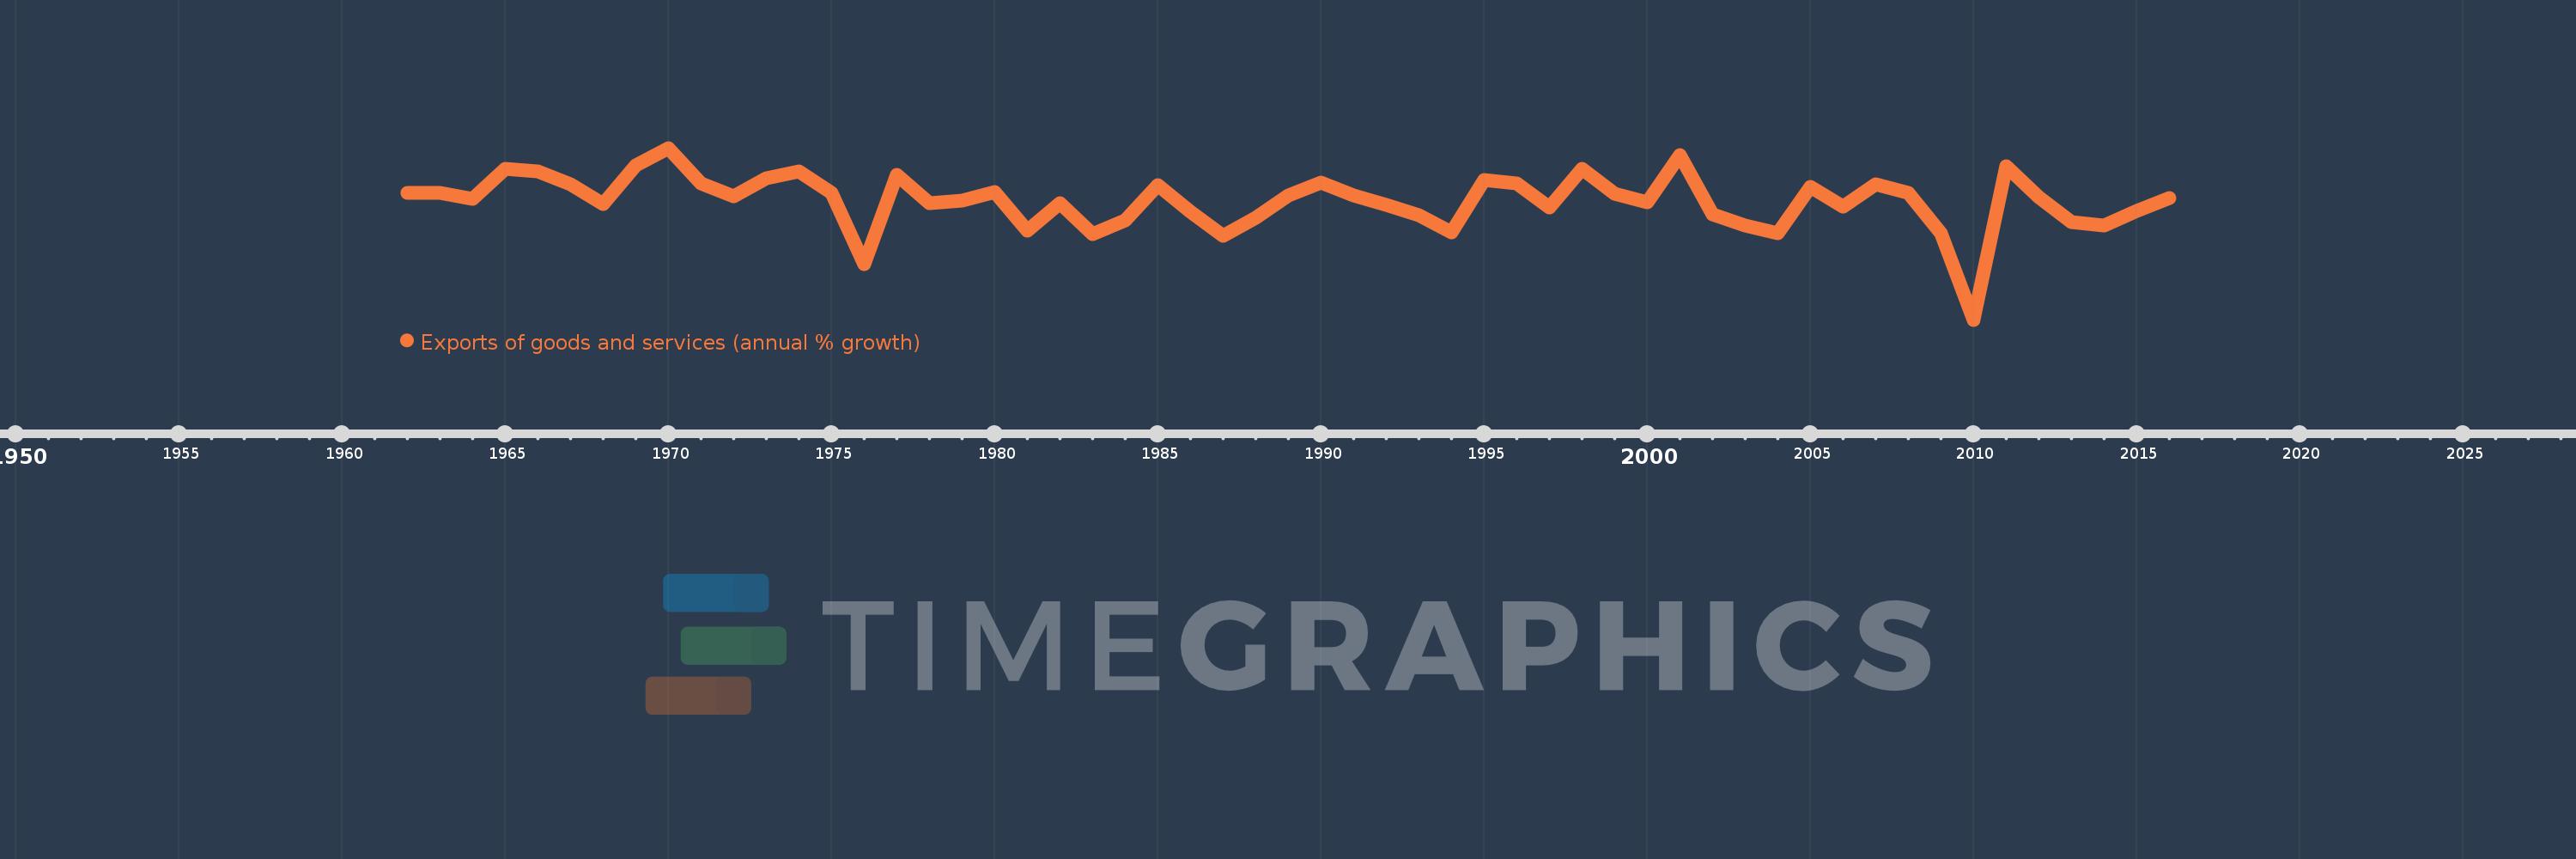
Exports of goods and services (annual % growth)
2016,2015,2014,2013,2012,2011,2010,2009,2008,2007,2006,2005,2004,2003,2002,2001,2000,1999,1998,1997,1996,1995,1994,1993,1992,1991,1990,1989,1988,1987,1986,1985,1984,1983,1982,1981,1980,1979,1978,1977,1976,1975,1974,1973,1972,1971,1970,1969,1968,1967,1966,1965,1964,1963,1962
This statistics in other country:
AlbaniaAlgeriaAngolaAntigua and BarbudaArab WorldArgentinaArmeniaAustraliaAustriaAzerbaijanBahamas, TheBahrainBangladeshBarbadosBelarusBelgiumBelizeBeninBhutanBoliviaBosnia and HerzegovinaBotswanaBrazilBrunei DarussalamBulgariaBurkina FasoBurundiCabo VerdeCambodiaCameroonCanadaCaribbean small statesCentral Europe and the BalticsChadChileColombiaComorosCongo, Dem. Rep.Congo, Rep.Costa RicaCote d'IvoireCroatiaCubaCyprusCzech RepublicDenmarkDjiboutiDominican RepublicEarly-demographic dividendEast Asia & PacificEcuadorEgypt, Arab Rep.El SalvadorEquatorial GuineaEritreaEstoniaEthiopiaEuro areaEurope & Central AsiaEurope & Central Asia (excluding high income)Europe & Central Asia (IDA & IBRD countries)European UnionFijiFinlandFranceGabonGambia, TheGeorgiaGermanyGhanaGreeceGuatemalaGuineaGuinea-BissauHaitiHeavily indebted poor countries (HIPC)High incomeHondurasHong Kong SAR, ChinaHungaryIBRD onlyIcelandIDA & IBRD totalIDA blendIDA onlyIDA totalIndiaIndonesiaIran, Islamic Rep.IrelandIsraelItalyJamaicaJapanJordanKazakhstanKenyaKorea, Rep.KosovoKuwaitKyrgyz RepublicLao PDRLatin America & Caribbean Latin America & Caribbean (excluding high income)Latin America & the Caribbean (IDA & IBRD countries)LatviaLebanonLiberiaLibyaLithuaniaLow & middle incomeLow incomeLower middle incomeLuxembourgMacao SAR, ChinaMacedonia, FYRMadagascarMalawiMalaysiaMaliMaltaMauritaniaMauritiusMexicoMiddle East & North AfricaMiddle East & North Africa (excluding high income)Middle East & North Africa (IDA & IBRD countries)Middle incomeMoldovaMongoliaMontenegroMoroccoMozambiqueMyanmarNamibiaNepalNetherlandsNew ZealandNicaraguaNigerNigeriaNorth AmericaNorwayOECD membersOmanOther small statesPakistanPanamaPapua New GuineaParaguayPeruPhilippinesPolandPortugalPost-demographic dividendPre-demographic dividendPuerto RicoQatarRomaniaRussian FederationRwandaSamoaSaudi ArabiaSenegalSerbiaSeychellesSierra LeoneSingaporeSlovak RepublicSloveniaSmall statesSomaliaSouth AfricaSouth AsiaSouth Asia (IDA & IBRD)South SudanSpainSri LankaSub-Saharan Africa Sub-Saharan Africa (excluding high income)Sub-Saharan Africa (IDA & IBRD countries)SudanSurinameSwazilandSwedenSwitzerlandSyrian Arab RepublicTajikistanTanzaniaThailandTimor-LesteTogoTrinidad and TobagoTunisiaTurkeyTurkmenistanUgandaUkraineUnited Arab EmiratesUnited KingdomUnited StatesUruguayUzbekistanVanuatuVenezuela, RBVietnamWest Bank and GazaWorldZambiaZimbabwe Timeline:
This timeline shows a graph from 1962 to 2016 of Euro area. No data until 1961. Number of actual observations by date: 55.
Source name:
World Development Indicators
Source organization:
World Bank national accounts data, and OECD National Accounts data files.
Categories, topics:
Economy & Growth, Trade
Last updated:
apr 23, 2017
Indicators value changes by year
Minimum:
-12.404
jan 1, 2010
Maximum:
14.132
jan 1, 1970
At the date of observation
Value
Absolute change
Change from previous value
jan 1, 1962
7.258
+7.258
0.0%
jan 1, 1963
7.204
-0.054
-0.75%
jan 1, 1964
6.316
-0.888
-12.33%
jan 1, 1965
10.879
+4.564
72.26%
jan 1, 1966
10.575
-0.304
-2.8%
jan 1, 1967
8.583
-1.992
-18.83%
jan 1, 1968
5.452
-3.131
-36.48%
jan 1, 1969
11.492
+6.04
110.77%
jan 1, 1970
14.132
+2.64
22.98%
jan 1, 1971
8.709
-5.423
-38.38%
jan 1, 1972
6.669
-2.039
-23.42%
jan 1, 1973
9.409
+2.739
41.08%
jan 1, 1974
10.553
+1.144
12.16%
jan 1, 1975
7.151
-3.402
-32.24%
jan 1, 1976
-3.87
-11.021
-154.13%
jan 1, 1977
9.997
+13.867
-358.28%
jan 1, 1978
5.606
-4.39
-43.92%
jan 1, 1979
6.042
+0.435
7.76%
jan 1, 1980
7.34
+1.298
21.49%
jan 1, 1981
1.383
-5.957
-81.16%
jan 1, 1982
5.589
+4.206
304.18%
jan 1, 1983
0.85
-4.738
-84.79%
jan 1, 1984
2.898
+2.048
240.96%
jan 1, 1985
8.422
+5.524
190.58%
jan 1, 1986
4.227
-4.196
-49.82%
jan 1, 1987
0.576
-3.65
-86.36%
jan 1, 1988
3.396
+2.82
489.28%
jan 1, 1989
6.817
+3.421
100.74%
jan 1, 1990
8.726
+1.909
28.0%
jan 1, 1991
6.86
-1.867
-21.39%
jan 1, 1992
5.347
-1.512
-22.05%
jan 1, 1993
3.691
-1.657
-30.98%
jan 1, 1994
1.098
-2.593
-70.26%
jan 1, 1995
9.177
+8.08
736.21%
jan 1, 1996
8.629
-0.549
-5.98%
jan 1, 1997
4.96
-3.669
-42.52%
jan 1, 1998
10.962
+6.002
121.02%
jan 1, 1999
7.105
-3.857
-35.18%
jan 1, 2000
5.67
-1.435
-20.2%
jan 1, 2001
13.074
+7.404
130.57%
jan 1, 2002
3.883
-9.191
-70.3%
jan 1, 2003
2.1
-1.783
-45.92%
jan 1, 2004
0.954
-1.146
-54.55%
jan 1, 2005
8.118
+7.163
750.5%
jan 1, 2006
5.114
-3.004
-37.0%
jan 1, 2007
8.545
+3.432
67.1%
jan 1, 2008
7.158
-1.387
-16.24%
jan 1, 2009
0.905
-6.254
-87.36%
jan 1, 2010
-12.404
-13.308
-1.47K%
jan 1, 2011
11.284
+23.687
-190.97%
jan 1, 2012
6.555
-4.729
-41.91%
jan 1, 2013
2.634
-3.921
-59.82%
jan 1, 2014
2.15
-0.484
-18.36%
jan 1, 2015
4.41
+2.26
105.12%
jan 1, 2016
6.387
+1.977
44.83%
Ranking of countries by current statistics by years


Comments: