29
/
en
AIzaSyAYiBZKx7MnpbEhh9jyipgxe19OcubqV5w
April 1, 2024
216349
Pakistan
PAK
true
2
1
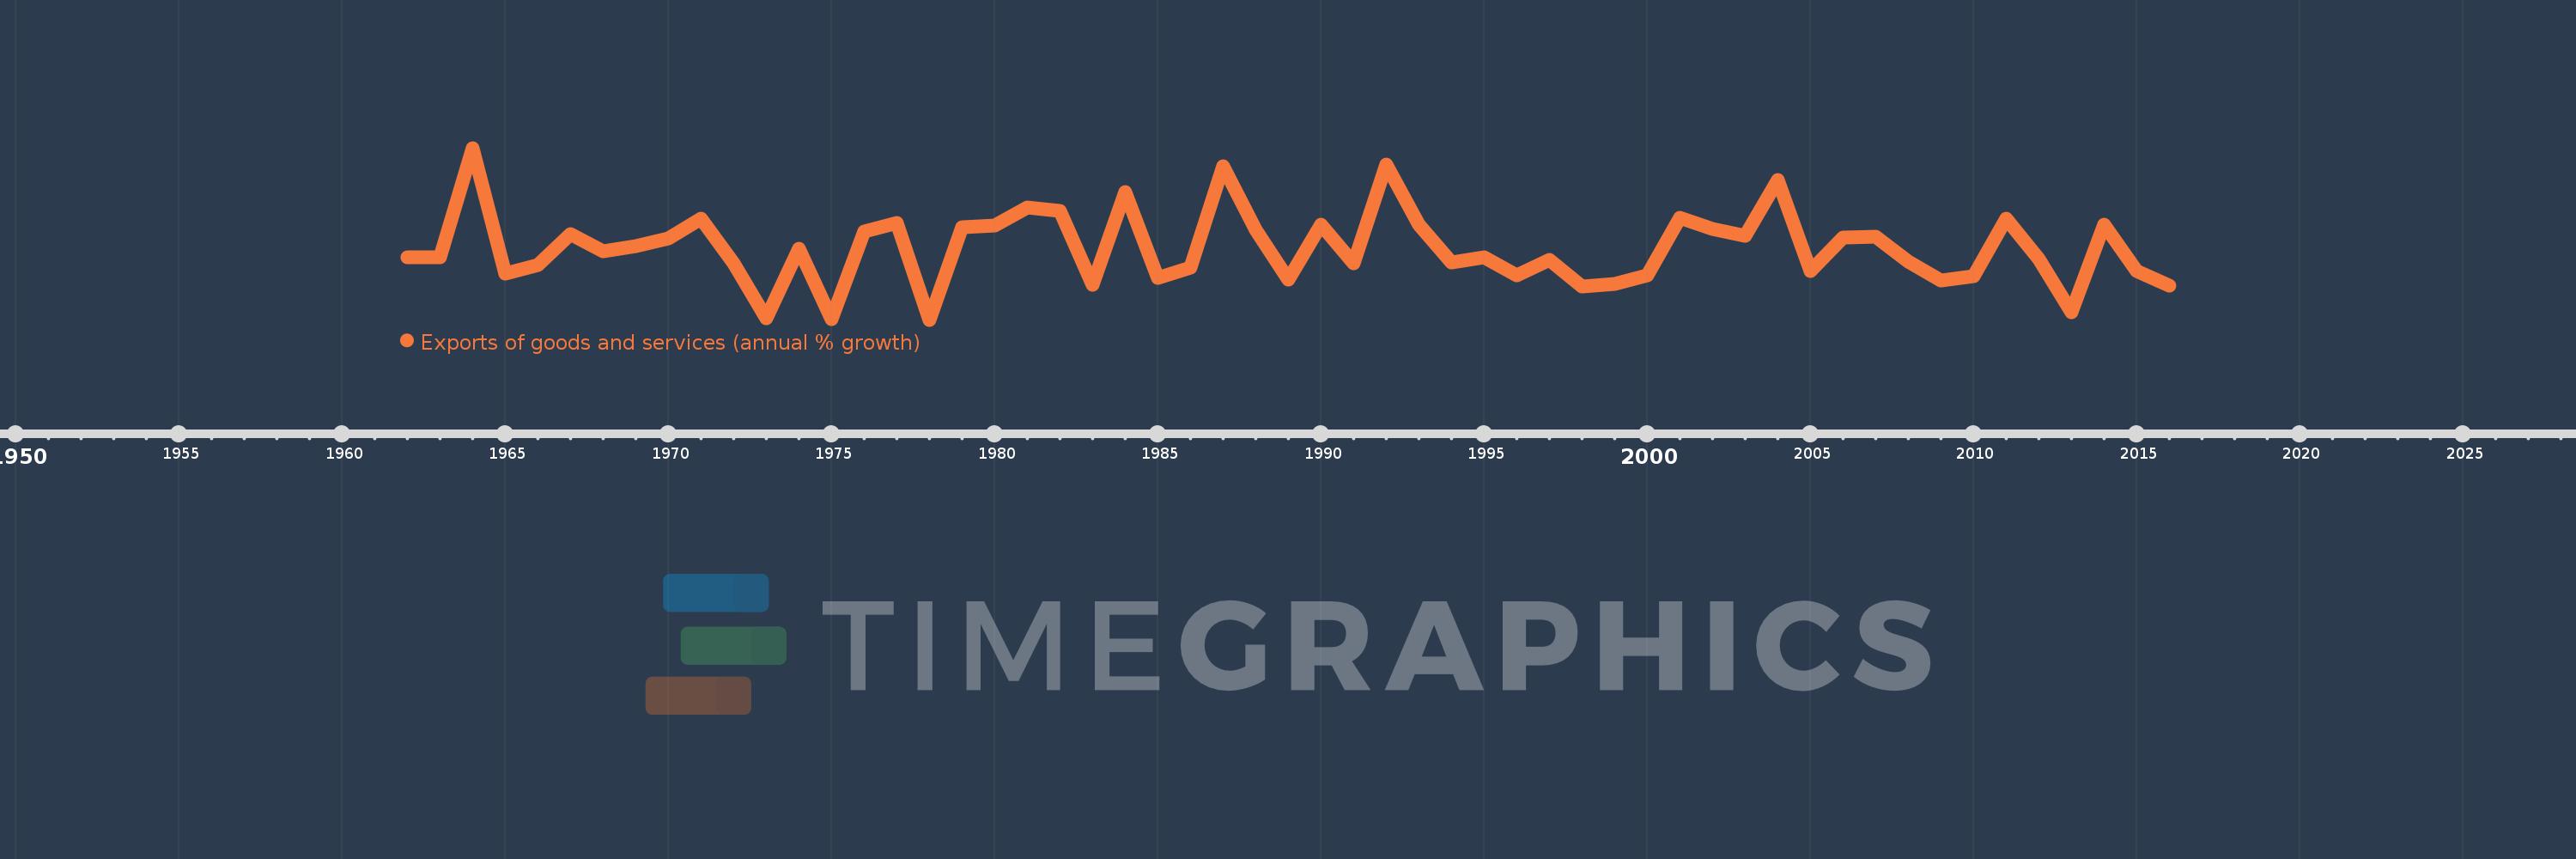
Exports of goods and services (annual % growth)
2016,2015,2014,2013,2012,2011,2010,2009,2008,2007,2006,2005,2004,2003,2002,2001,2000,1999,1998,1997,1996,1995,1994,1993,1992,1991,1990,1989,1988,1987,1986,1985,1984,1983,1982,1981,1980,1979,1978,1977,1976,1975,1974,1973,1972,1971,1970,1969,1968,1967,1966,1965,1964,1963,1962
This statistics in other country:
AlbaniaAlgeriaAngolaAntigua and BarbudaArab WorldArgentinaArmeniaAustraliaAustriaAzerbaijanBahamas, TheBahrainBangladeshBarbadosBelarusBelgiumBelizeBeninBhutanBoliviaBosnia and HerzegovinaBotswanaBrazilBrunei DarussalamBulgariaBurkina FasoBurundiCabo VerdeCambodiaCameroonCanadaCaribbean small statesCentral Europe and the BalticsChadChileColombiaComorosCongo, Dem. Rep.Congo, Rep.Costa RicaCote d'IvoireCroatiaCubaCyprusCzech RepublicDenmarkDjiboutiDominican RepublicEarly-demographic dividendEast Asia & PacificEcuadorEgypt, Arab Rep.El SalvadorEquatorial GuineaEritreaEstoniaEthiopiaEuro areaEurope & Central AsiaEurope & Central Asia (excluding high income)Europe & Central Asia (IDA & IBRD countries)European UnionFijiFinlandFranceGabonGambia, TheGeorgiaGermanyGhanaGreeceGuatemalaGuineaGuinea-BissauHaitiHeavily indebted poor countries (HIPC)High incomeHondurasHong Kong SAR, ChinaHungaryIBRD onlyIcelandIDA & IBRD totalIDA blendIDA onlyIDA totalIndiaIndonesiaIran, Islamic Rep.IrelandIsraelItalyJamaicaJapanJordanKazakhstanKenyaKorea, Rep.KosovoKuwaitKyrgyz RepublicLao PDRLatin America & Caribbean Latin America & Caribbean (excluding high income)Latin America & the Caribbean (IDA & IBRD countries)LatviaLebanonLiberiaLibyaLithuaniaLow & middle incomeLow incomeLower middle incomeLuxembourgMacao SAR, ChinaMacedonia, FYRMadagascarMalawiMalaysiaMaliMaltaMauritaniaMauritiusMexicoMiddle East & North AfricaMiddle East & North Africa (excluding high income)Middle East & North Africa (IDA & IBRD countries)Middle incomeMoldovaMongoliaMontenegroMoroccoMozambiqueMyanmarNamibiaNepalNetherlandsNew ZealandNicaraguaNigerNigeriaNorth AmericaNorwayOECD membersOmanOther small statesPakistanPanamaPapua New GuineaParaguayPeruPhilippinesPolandPortugalPost-demographic dividendPre-demographic dividendPuerto RicoQatarRomaniaRussian FederationRwandaSamoaSaudi ArabiaSenegalSerbiaSeychellesSierra LeoneSingaporeSlovak RepublicSloveniaSmall statesSomaliaSouth AfricaSouth AsiaSouth Asia (IDA & IBRD)South SudanSpainSri LankaSub-Saharan Africa Sub-Saharan Africa (excluding high income)Sub-Saharan Africa (IDA & IBRD countries)SudanSurinameSwazilandSwedenSwitzerlandSyrian Arab RepublicTajikistanTanzaniaThailandTimor-LesteTogoTrinidad and TobagoTunisiaTurkeyTurkmenistanUgandaUkraineUnited Arab EmiratesUnited KingdomUnited StatesUruguayUzbekistanVanuatuVenezuela, RBVietnamWest Bank and GazaWorldZambiaZimbabwe Timeline:
This timeline shows a graph from 1962 to 2016 of Pakistan. No data until 1961. Number of actual observations by date: 55.
Source name:
World Development Indicators
Source organization:
World Bank national accounts data, and OECD National Accounts data files.
Categories, topics:
Economy & Growth, Trade
Last updated:
apr 23, 2017
Indicators value changes by year
Minimum:
-17.582
jan 1, 1978
Maximum:
38.967
jan 1, 1964
At the date of observation
Value
Absolute change
Change from previous value
jan 1, 1962
2.993
+2.993
0.0%
jan 1, 1963
3.077
+0.083
2.79%
jan 1, 1964
38.967
+35.89
1.17K%
jan 1, 1965
-2.523
-41.489
-106.47%
jan 1, 1966
0.555
+3.078
-122.02%
jan 1, 1967
10.713
+10.158
1.83K%
jan 1, 1968
4.841
-5.872
-54.81%
jan 1, 1969
6.725
+1.884
38.92%
jan 1, 1970
9.06
+2.335
34.72%
jan 1, 1971
15.837
+6.777
74.81%
jan 1, 1972
0.888
-14.949
-94.39%
jan 1, 1973
-17.184
-18.073
-2.03K%
jan 1, 1974
5.747
+22.931
-133.44%
jan 1, 1975
-17.274
-23.021
-400.58%
jan 1, 1976
11.547
+28.821
-166.85%
jan 1, 1977
14.153
+2.606
22.57%
jan 1, 1978
-17.582
-31.735
-224.23%
jan 1, 1979
12.757
+30.339
-172.56%
jan 1, 1980
13.309
+0.552
4.33%
jan 1, 1981
19.507
+6.197
46.56%
jan 1, 1982
18.247
-1.26
-6.46%
jan 1, 1983
-5.985
-24.232
-132.8%
jan 1, 1984
24.573
+30.557
-510.58%
jan 1, 1985
-3.692
-28.265
-115.03%
jan 1, 1986
-0.36
+3.332
-90.25%
jan 1, 1987
32.808
+33.168
-9.21K%
jan 1, 1988
11.99
-20.819
-63.46%
jan 1, 1989
-4.313
-16.302
-135.97%
jan 1, 1990
13.775
+18.087
-419.41%
jan 1, 1991
1.125
-12.65
-91.83%
jan 1, 1992
33.465
+32.34
2.87K%
jan 1, 1993
13.821
-19.644
-58.7%
jan 1, 1994
1.317
-12.504
-90.47%
jan 1, 1995
3.111
+1.793
136.13%
jan 1, 1996
-3.075
-6.186
-198.86%
jan 1, 1997
1.995
+5.07
-164.86%
jan 1, 1998
-6.536
-8.531
-427.69%
jan 1, 1999
-5.73
+0.806
-12.33%
jan 1, 2000
-2.85
+2.88
-50.26%
jan 1, 2001
16.016
+18.866
-661.9%
jan 1, 2002
12.183
-3.833
-23.93%
jan 1, 2003
9.96
-2.223
-18.25%
jan 1, 2004
28.377
+18.417
184.91%
jan 1, 2005
-1.528
-29.905
-105.38%
jan 1, 2006
9.59
+11.118
-727.72%
jan 1, 2007
9.895
+0.305
3.18%
jan 1, 2008
1.51
-8.385
-84.74%
jan 1, 2009
-4.552
-6.062
-401.52%
jan 1, 2010
-3.361
+1.191
-26.16%
jan 1, 2011
15.708
+19.069
-567.33%
jan 1, 2012
2.372
-13.335
-84.9%
jan 1, 2013
-15.001
-17.373
-732.36%
jan 1, 2014
13.581
+28.582
-190.53%
jan 1, 2015
-1.48
-15.061
-110.9%
jan 1, 2016
-6.344
-4.863
328.57%
Ranking of countries by current statistics by years


Comments: