29
/
en
AIzaSyAYiBZKx7MnpbEhh9jyipgxe19OcubqV5w
April 1, 2024
112175
Costa Rica
CRI
true
2
1
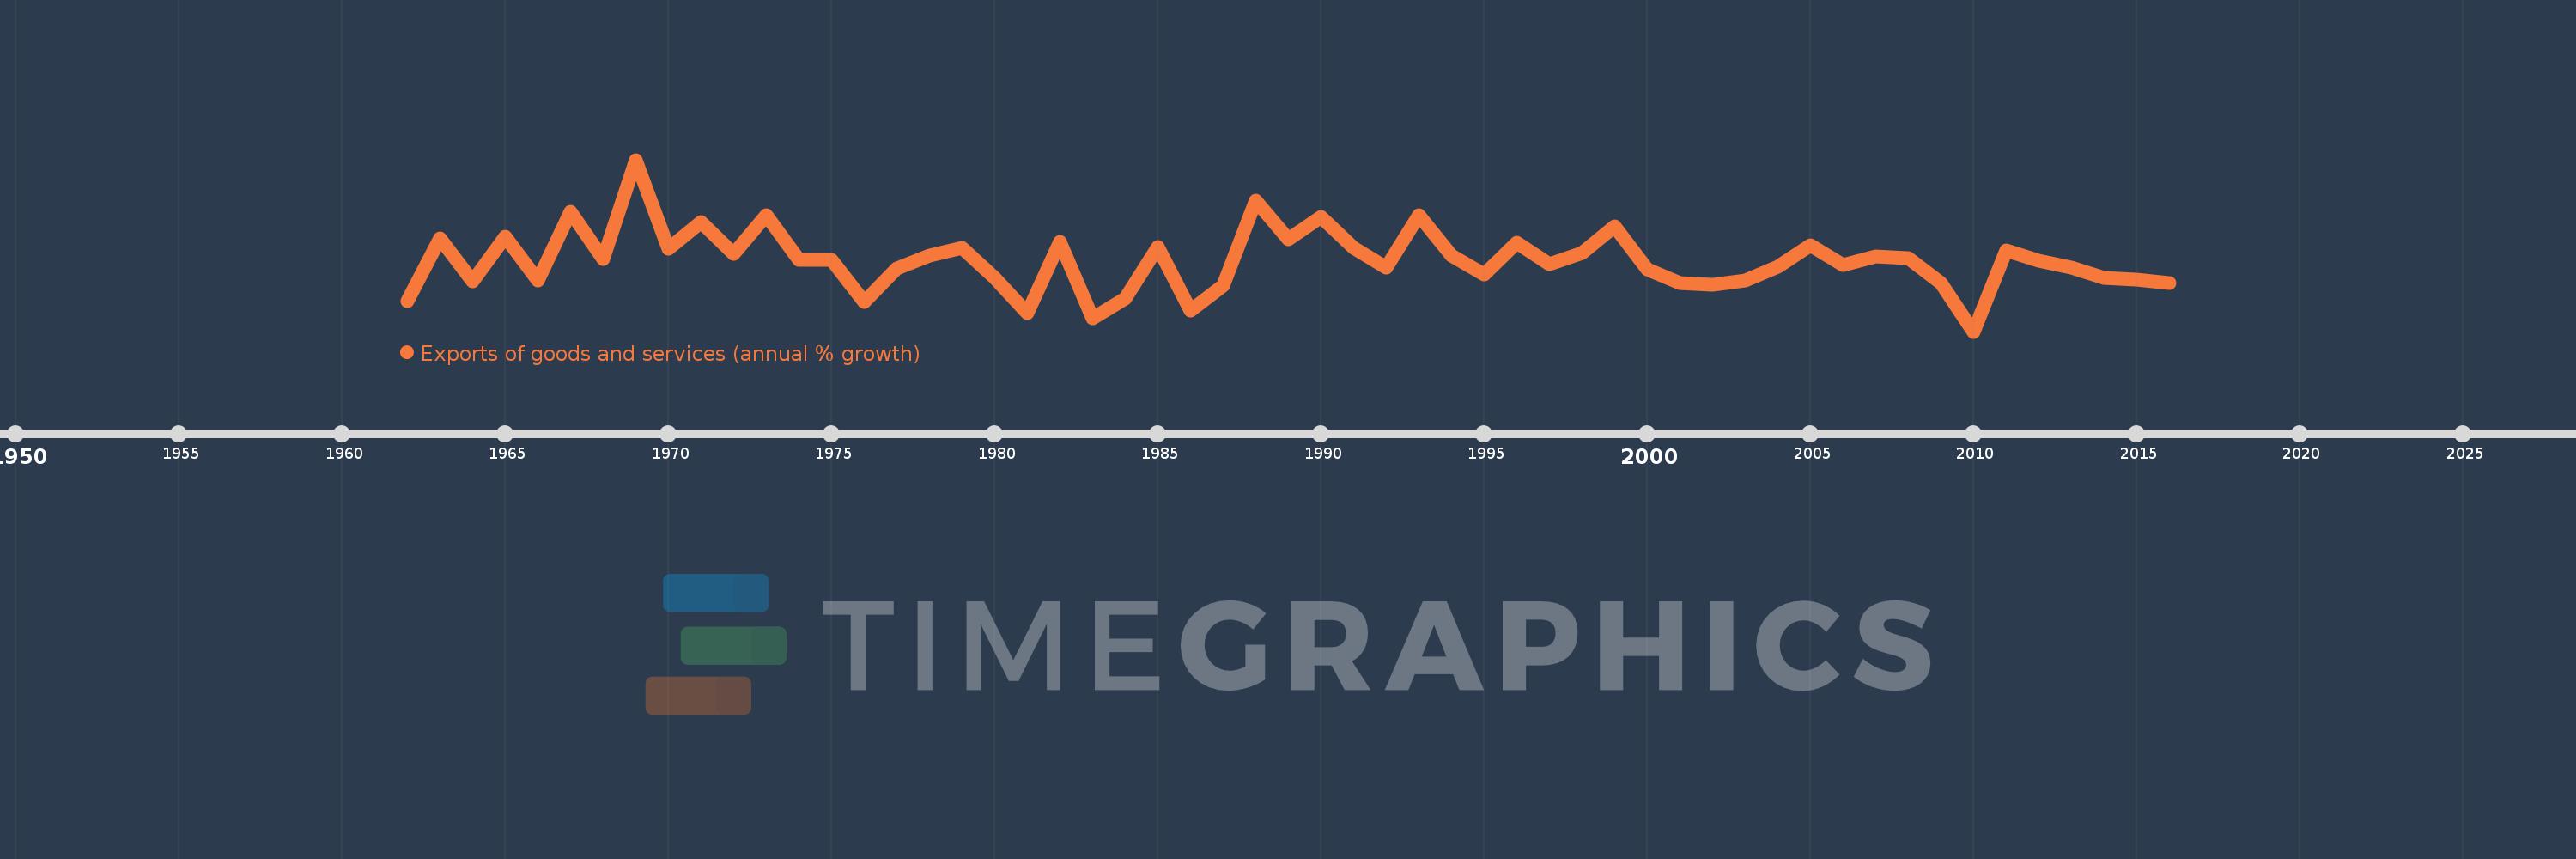
Exports of goods and services (annual % growth)
2016,2015,2014,2013,2012,2011,2010,2009,2008,2007,2006,2005,2004,2003,2002,2001,2000,1999,1998,1997,1996,1995,1994,1993,1992,1991,1990,1989,1988,1987,1986,1985,1984,1983,1982,1981,1980,1979,1978,1977,1976,1975,1974,1973,1972,1971,1970,1969,1968,1967,1966,1965,1964,1963,1962
This statistics in other country:
AlbaniaAlgeriaAngolaAntigua and BarbudaArab WorldArgentinaArmeniaAustraliaAustriaAzerbaijanBahamas, TheBahrainBangladeshBarbadosBelarusBelgiumBelizeBeninBhutanBoliviaBosnia and HerzegovinaBotswanaBrazilBrunei DarussalamBulgariaBurkina FasoBurundiCabo VerdeCambodiaCameroonCanadaCaribbean small statesCentral Europe and the BalticsChadChileColombiaComorosCongo, Dem. Rep.Congo, Rep.Costa RicaCote d'IvoireCroatiaCubaCyprusCzech RepublicDenmarkDjiboutiDominican RepublicEarly-demographic dividendEast Asia & PacificEcuadorEgypt, Arab Rep.El SalvadorEquatorial GuineaEritreaEstoniaEthiopiaEuro areaEurope & Central AsiaEurope & Central Asia (excluding high income)Europe & Central Asia (IDA & IBRD countries)European UnionFijiFinlandFranceGabonGambia, TheGeorgiaGermanyGhanaGreeceGuatemalaGuineaGuinea-BissauHaitiHeavily indebted poor countries (HIPC)High incomeHondurasHong Kong SAR, ChinaHungaryIBRD onlyIcelandIDA & IBRD totalIDA blendIDA onlyIDA totalIndiaIndonesiaIran, Islamic Rep.IrelandIsraelItalyJamaicaJapanJordanKazakhstanKenyaKorea, Rep.KosovoKuwaitKyrgyz RepublicLao PDRLatin America & Caribbean Latin America & Caribbean (excluding high income)Latin America & the Caribbean (IDA & IBRD countries)LatviaLebanonLiberiaLibyaLithuaniaLow & middle incomeLow incomeLower middle incomeLuxembourgMacao SAR, ChinaMacedonia, FYRMadagascarMalawiMalaysiaMaliMaltaMauritaniaMauritiusMexicoMiddle East & North AfricaMiddle East & North Africa (excluding high income)Middle East & North Africa (IDA & IBRD countries)Middle incomeMoldovaMongoliaMontenegroMoroccoMozambiqueMyanmarNamibiaNepalNetherlandsNew ZealandNicaraguaNigerNigeriaNorth AmericaNorwayOECD membersOmanOther small statesPakistanPanamaPapua New GuineaParaguayPeruPhilippinesPolandPortugalPost-demographic dividendPre-demographic dividendPuerto RicoQatarRomaniaRussian FederationRwandaSamoaSaudi ArabiaSenegalSerbiaSeychellesSierra LeoneSingaporeSlovak RepublicSloveniaSmall statesSomaliaSouth AfricaSouth AsiaSouth Asia (IDA & IBRD)South SudanSpainSri LankaSub-Saharan Africa Sub-Saharan Africa (excluding high income)Sub-Saharan Africa (IDA & IBRD countries)SudanSurinameSwazilandSwedenSwitzerlandSyrian Arab RepublicTajikistanTanzaniaThailandTimor-LesteTogoTrinidad and TobagoTunisiaTurkeyTurkmenistanUgandaUkraineUnited Arab EmiratesUnited KingdomUnited StatesUruguayUzbekistanVanuatuVenezuela, RBVietnamWest Bank and GazaWorldZambiaZimbabwe Timeline:
This timeline shows a graph from 1962 to 2016 of Costa Rica. No data until 1961. Number of actual observations by date: 55.
Source name:
World Development Indicators
Source organization:
World Bank national accounts data, and OECD National Accounts data files.
Categories, topics:
Economy & Growth, Trade
Last updated:
apr 23, 2017
Indicators value changes by year
Minimum:
-8.462
jan 1, 2010
Maximum:
29.095
jan 1, 1969
At the date of observation
Value
Absolute change
Change from previous value
jan 1, 1962
-1.835
-1.835
0.0%
jan 1, 1963
11.948
+13.783
-751.18%
jan 1, 1964
2.53
-9.418
-78.82%
jan 1, 1965
12.251
+9.721
384.2%
jan 1, 1966
2.623
-9.628
-78.59%
jan 1, 1967
17.649
+15.026
572.95%
jan 1, 1968
7.376
-10.273
-58.21%
jan 1, 1969
29.095
+21.719
294.46%
jan 1, 1970
9.635
-19.46
-66.88%
jan 1, 1971
15.4
+5.764
59.83%
jan 1, 1972
8.533
-6.867
-44.59%
jan 1, 1973
17.064
+8.531
99.98%
jan 1, 1974
7.288
-9.776
-57.29%
jan 1, 1975
7.261
-0.027
-0.37%
jan 1, 1976
-1.972
-9.233
-127.15%
jan 1, 1977
5.42
+7.392
-374.89%
jan 1, 1978
8.155
+2.735
50.46%
jan 1, 1979
9.94
+1.785
21.88%
jan 1, 1980
3.259
-6.681
-67.21%
jan 1, 1981
-4.344
-7.603
-233.28%
jan 1, 1982
11.119
+15.463
-355.99%
jan 1, 1983
-5.458
-16.577
-149.08%
jan 1, 1984
-1.312
+4.146
-75.97%
jan 1, 1985
10.082
+11.393
-868.57%
jan 1, 1986
-3.828
-13.909
-137.97%
jan 1, 1987
1.636
+5.463
-142.74%
jan 1, 1988
20.246
+18.61
1.14K%
jan 1, 1989
11.756
-8.49
-41.94%
jan 1, 1990
16.651
+4.895
41.64%
jan 1, 1991
9.933
-6.718
-40.35%
jan 1, 1992
5.545
-4.388
-44.18%
jan 1, 1993
17.068
+11.523
207.81%
jan 1, 1994
8.095
-8.973
-52.57%
jan 1, 1995
3.941
-4.154
-51.31%
jan 1, 1996
11.018
+7.077
179.56%
jan 1, 1997
6.257
-4.762
-43.22%
jan 1, 1998
8.695
+2.439
38.98%
jan 1, 1999
14.459
+5.763
66.28%
jan 1, 2000
5.119
-9.34
-64.6%
jan 1, 2001
2.24
-2.878
-56.23%
jan 1, 2002
1.702
-0.538
-24.03%
jan 1, 2003
2.68
+0.978
57.47%
jan 1, 2004
5.671
+2.991
111.6%
jan 1, 2005
10.383
+4.712
83.09%
jan 1, 2006
6.012
-4.371
-42.1%
jan 1, 2007
8.041
+2.03
33.76%
jan 1, 2008
7.523
-0.519
-6.45%
jan 1, 2009
2.172
-5.351
-71.13%
jan 1, 2010
-8.462
-10.634
-489.57%
jan 1, 2011
9.327
+17.789
-210.23%
jan 1, 2012
7.048
-2.279
-24.44%
jan 1, 2013
5.57
-1.479
-20.98%
jan 1, 2014
3.308
-2.261
-40.6%
jan 1, 2015
2.992
-0.316
-9.56%
jan 1, 2016
2.146
-0.846
-28.26%
Ranking of countries by current statistics by years


Comments: