29
/
en
AIzaSyAYiBZKx7MnpbEhh9jyipgxe19OcubqV5w
April 1, 2024
87153
Bolivia
BOL
true
2
1
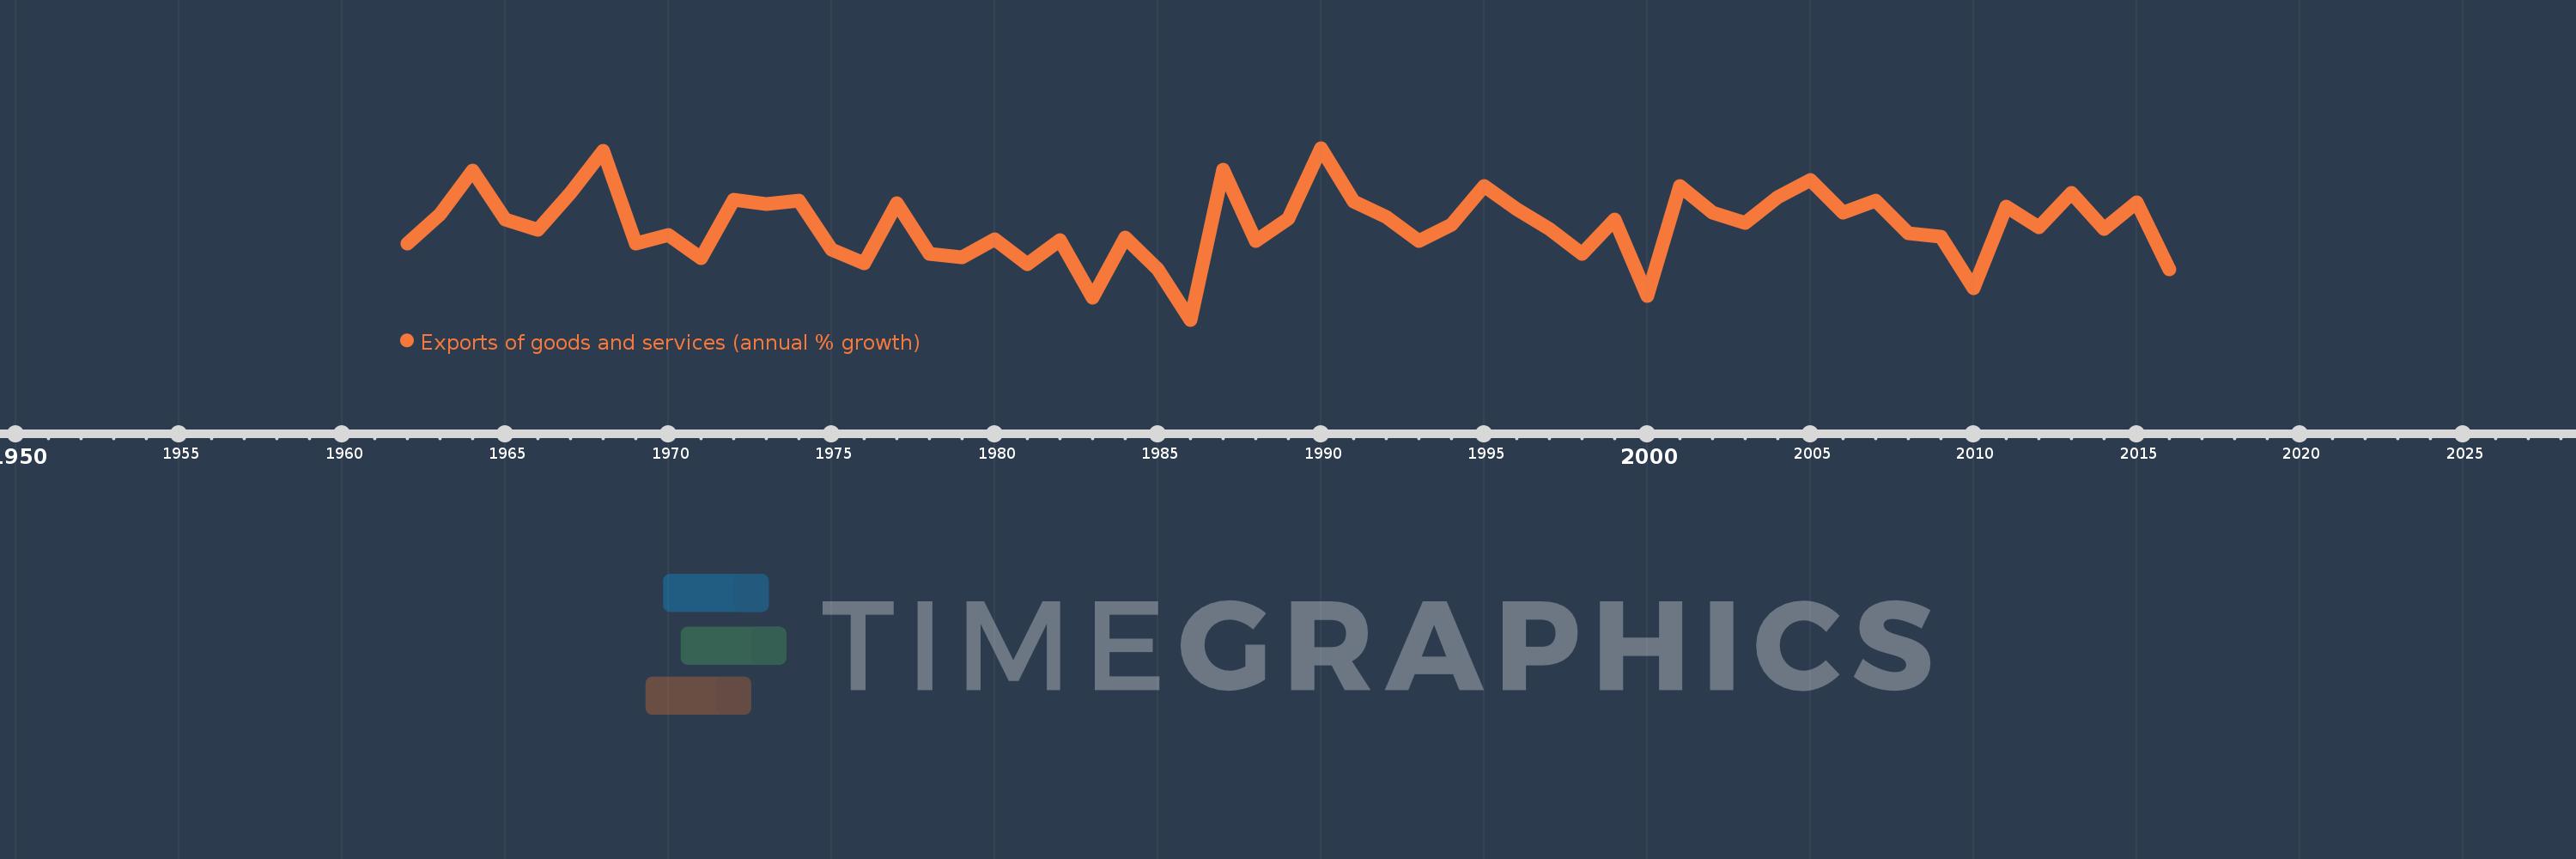
Exports of goods and services (annual % growth)
2016,2015,2014,2013,2012,2011,2010,2009,2008,2007,2006,2005,2004,2003,2002,2001,2000,1999,1998,1997,1996,1995,1994,1993,1992,1991,1990,1989,1988,1987,1986,1985,1984,1983,1982,1981,1980,1979,1978,1977,1976,1975,1974,1973,1972,1971,1970,1969,1968,1967,1966,1965,1964,1963,1962
This statistics in other country:
AlbaniaAlgeriaAngolaAntigua and BarbudaArab WorldArgentinaArmeniaAustraliaAustriaAzerbaijanBahamas, TheBahrainBangladeshBarbadosBelarusBelgiumBelizeBeninBhutanBoliviaBosnia and HerzegovinaBotswanaBrazilBrunei DarussalamBulgariaBurkina FasoBurundiCabo VerdeCambodiaCameroonCanadaCaribbean small statesCentral Europe and the BalticsChadChileColombiaComorosCongo, Dem. Rep.Congo, Rep.Costa RicaCote d'IvoireCroatiaCubaCyprusCzech RepublicDenmarkDjiboutiDominican RepublicEarly-demographic dividendEast Asia & PacificEcuadorEgypt, Arab Rep.El SalvadorEquatorial GuineaEritreaEstoniaEthiopiaEuro areaEurope & Central AsiaEurope & Central Asia (excluding high income)Europe & Central Asia (IDA & IBRD countries)European UnionFijiFinlandFranceGabonGambia, TheGeorgiaGermanyGhanaGreeceGuatemalaGuineaGuinea-BissauHaitiHeavily indebted poor countries (HIPC)High incomeHondurasHong Kong SAR, ChinaHungaryIBRD onlyIcelandIDA & IBRD totalIDA blendIDA onlyIDA totalIndiaIndonesiaIran, Islamic Rep.IrelandIsraelItalyJamaicaJapanJordanKazakhstanKenyaKorea, Rep.KosovoKuwaitKyrgyz RepublicLao PDRLatin America & Caribbean Latin America & Caribbean (excluding high income)Latin America & the Caribbean (IDA & IBRD countries)LatviaLebanonLiberiaLibyaLithuaniaLow & middle incomeLow incomeLower middle incomeLuxembourgMacao SAR, ChinaMacedonia, FYRMadagascarMalawiMalaysiaMaliMaltaMauritaniaMauritiusMexicoMiddle East & North AfricaMiddle East & North Africa (excluding high income)Middle East & North Africa (IDA & IBRD countries)Middle incomeMoldovaMongoliaMontenegroMoroccoMozambiqueMyanmarNamibiaNepalNetherlandsNew ZealandNicaraguaNigerNigeriaNorth AmericaNorwayOECD membersOmanOther small statesPakistanPanamaPapua New GuineaParaguayPeruPhilippinesPolandPortugalPost-demographic dividendPre-demographic dividendPuerto RicoQatarRomaniaRussian FederationRwandaSamoaSaudi ArabiaSenegalSerbiaSeychellesSierra LeoneSingaporeSlovak RepublicSloveniaSmall statesSomaliaSouth AfricaSouth AsiaSouth Asia (IDA & IBRD)South SudanSpainSri LankaSub-Saharan Africa Sub-Saharan Africa (excluding high income)Sub-Saharan Africa (IDA & IBRD countries)SudanSurinameSwazilandSwedenSwitzerlandSyrian Arab RepublicTajikistanTanzaniaThailandTimor-LesteTogoTrinidad and TobagoTunisiaTurkeyTurkmenistanUgandaUkraineUnited Arab EmiratesUnited KingdomUnited StatesUruguayUzbekistanVanuatuVenezuela, RBVietnamWest Bank and GazaWorldZambiaZimbabwe Timeline:
This timeline shows a graph from 1962 to 2016 of Bolivia. No data until 1961. Number of actual observations by date: 55.
Source name:
World Development Indicators
Source organization:
World Bank national accounts data, and OECD National Accounts data files.
Categories, topics:
Economy & Growth, Trade
Last updated:
apr 23, 2017
Indicators value changes by year
Minimum:
-18.742
jan 1, 1986
At the date of observation
Value
Absolute change
Change from previous value
jan 1, 1962
0.587
+0.587
0.0%
jan 1, 1963
7.883
+7.296
1.24K%
jan 1, 1964
18.969
+11.085
140.62%
jan 1, 1965
6.656
-12.312
-64.91%
jan 1, 1966
3.846
-2.81
-42.22%
jan 1, 1967
13.208
+9.361
243.4%
jan 1, 1968
23.827
+10.62
80.41%
jan 1, 1969
0.499
-23.329
-97.91%
jan 1, 1970
2.679
+2.18
437.32%
jan 1, 1971
-3.299
-5.977
-223.15%
jan 1, 1972
11.551
+14.849
-450.18%
jan 1, 1973
10.419
-1.132
-9.8%
jan 1, 1974
11.231
+0.812
7.8%
jan 1, 1975
-1.0
-12.23
-108.9%
jan 1, 1976
-4.4
-3.4
340.18%
jan 1, 1977
10.759
+15.159
-344.51%
jan 1, 1978
-2.009
-12.768
-118.68%
jan 1, 1979
-2.991
-0.982
48.85%
jan 1, 1980
1.558
+4.549
-152.11%
jan 1, 1981
-4.788
-6.346
-407.22%
jan 1, 1982
1.293
+6.081
-127.01%
jan 1, 1983
-13.122
-14.415
-1.11K%
jan 1, 1984
1.904
+15.026
-114.51%
jan 1, 1985
-6.065
-7.97
-418.51%
jan 1, 1986
-18.742
-12.677
208.99%
jan 1, 1987
19.133
+37.875
-202.08%
jan 1, 1988
1.105
-18.028
-94.23%
jan 1, 1989
6.709
+5.604
507.22%
jan 1, 1990
24.61
+17.901
266.82%
jan 1, 1991
11.068
-13.541
-55.02%
jan 1, 1992
7.294
-3.775
-34.1%
jan 1, 1993
1.113
-6.181
-84.74%
jan 1, 1994
5.305
+4.192
376.68%
jan 1, 1995
15.097
+9.792
184.59%
jan 1, 1996
9.118
-5.978
-39.6%
jan 1, 1997
4.069
-5.05
-55.38%
jan 1, 1998
-2.11
-6.179
-151.86%
jan 1, 1999
6.482
+8.593
-407.19%
jan 1, 2000
-12.805
-19.287
-297.53%
jan 1, 2001
15.041
+27.845
-217.46%
jan 1, 2002
8.377
-6.663
-44.3%
jan 1, 2003
5.693
-2.684
-32.04%
jan 1, 2004
12.163
+6.47
113.64%
jan 1, 2005
16.621
+4.457
36.65%
jan 1, 2006
8.336
-8.284
-49.84%
jan 1, 2007
11.337
+3.001
35.99%
jan 1, 2008
3.085
-8.252
-72.79%
jan 1, 2009
2.18
-0.906
-29.35%
jan 1, 2010
-10.761
-12.941
-593.72%
jan 1, 2011
9.862
+20.623
-191.64%
jan 1, 2012
4.586
-5.276
-53.5%
jan 1, 2013
13.303
+8.718
190.1%
jan 1, 2014
4.092
-9.211
-69.24%
jan 1, 2015
10.869
+6.776
165.59%
jan 1, 2016
-5.922
-16.79
-154.49%
Ranking of countries by current statistics by years


Comments: