29
/
en
AIzaSyAYiBZKx7MnpbEhh9jyipgxe19OcubqV5w
April 1, 2024
190165
Mali
MLI
true
2
1
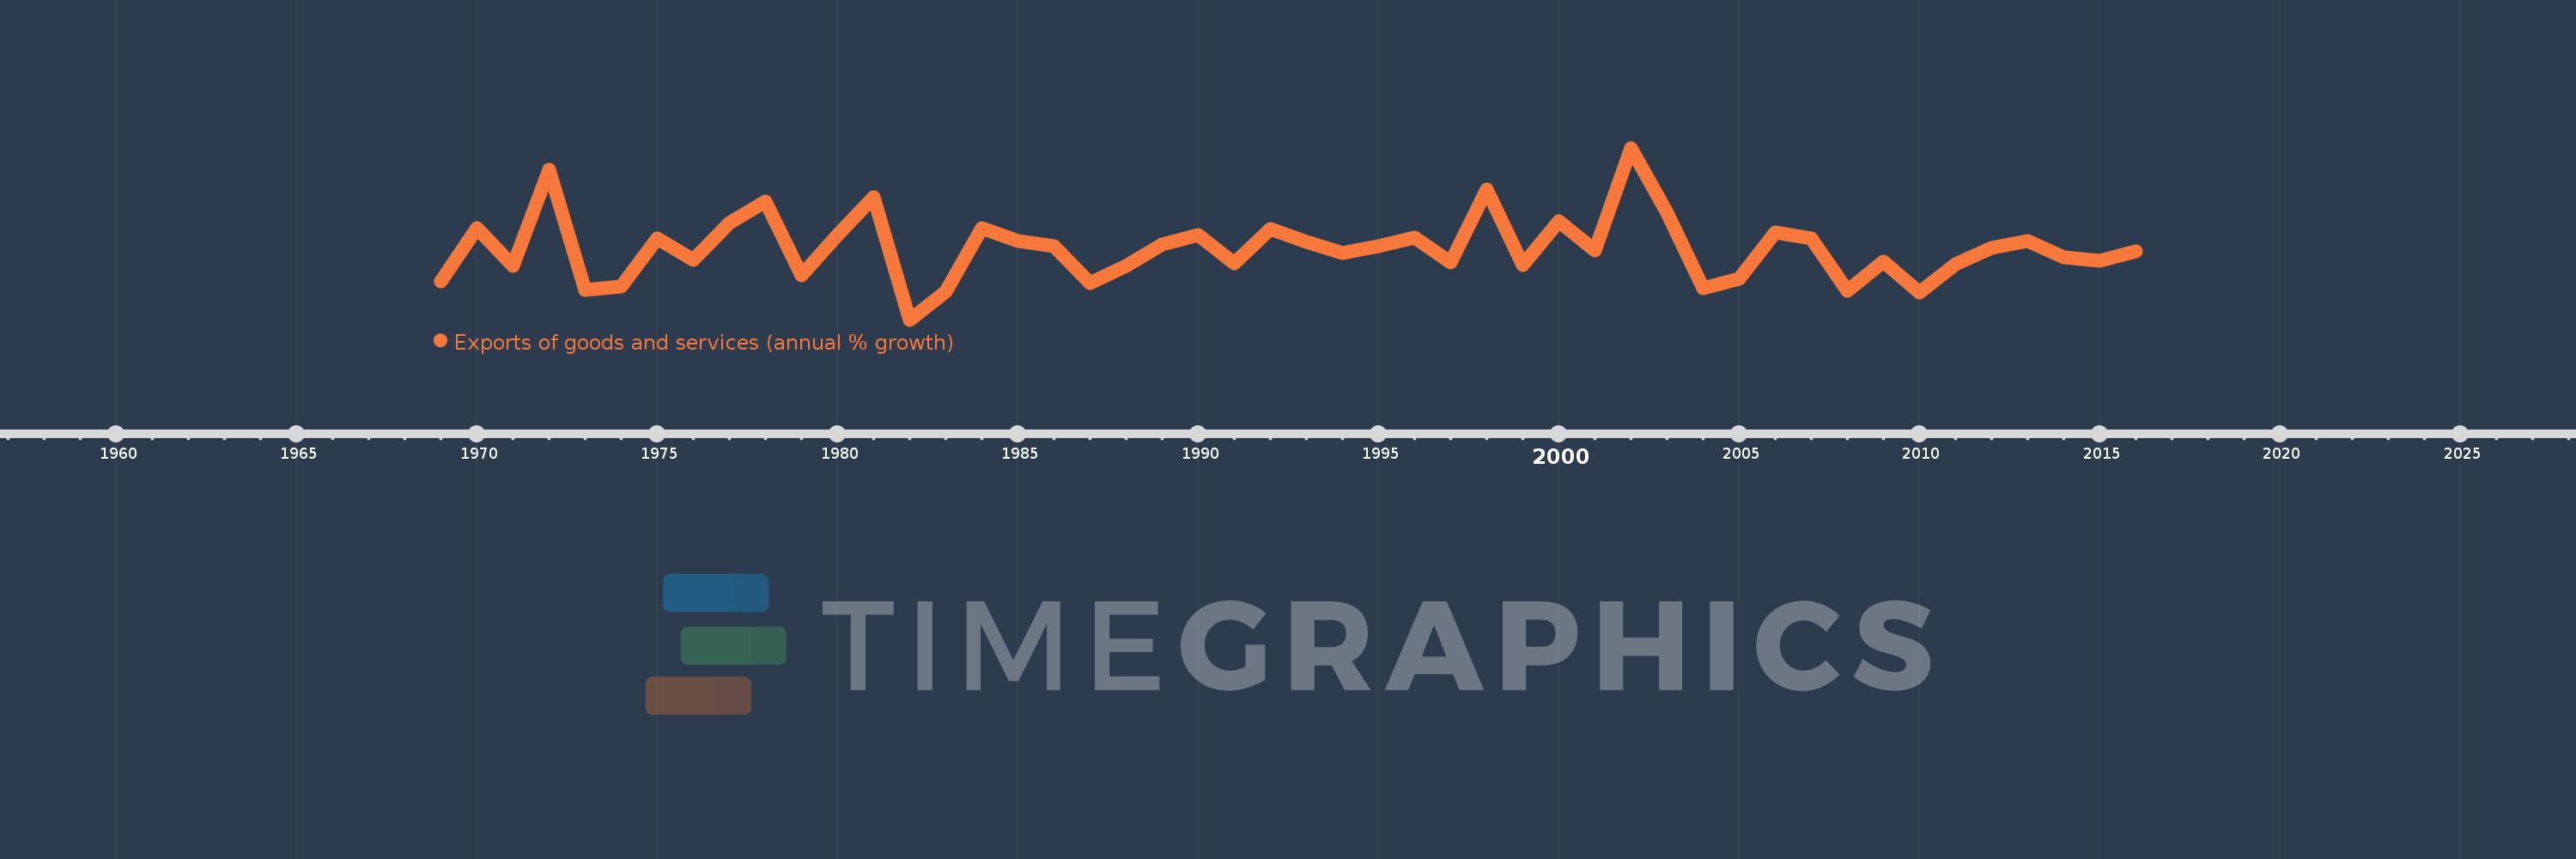
Exports of goods and services (annual % growth)
2016,2015,2014,2013,2012,2011,2010,2009,2008,2007,2006,2005,2004,2003,2002,2001,2000,1999,1998,1997,1996,1995,1994,1993,1992,1991,1990,1989,1988,1987,1986,1985,1984,1983,1982,1981,1980,1979,1978,1977,1976,1975,1974,1973,1972,1971,1970,1969
This statistics in other country:
AlbaniaAlgeriaAngolaAntigua and BarbudaArab WorldArgentinaArmeniaAustraliaAustriaAzerbaijanBahamas, TheBahrainBangladeshBarbadosBelarusBelgiumBelizeBeninBhutanBoliviaBosnia and HerzegovinaBotswanaBrazilBrunei DarussalamBulgariaBurkina FasoBurundiCabo VerdeCambodiaCameroonCanadaCaribbean small statesCentral Europe and the BalticsChadChileColombiaComorosCongo, Dem. Rep.Congo, Rep.Costa RicaCote d'IvoireCroatiaCubaCyprusCzech RepublicDenmarkDjiboutiDominican RepublicEarly-demographic dividendEast Asia & PacificEcuadorEgypt, Arab Rep.El SalvadorEquatorial GuineaEritreaEstoniaEthiopiaEuro areaEurope & Central AsiaEurope & Central Asia (excluding high income)Europe & Central Asia (IDA & IBRD countries)European UnionFijiFinlandFranceGabonGambia, TheGeorgiaGermanyGhanaGreeceGuatemalaGuineaGuinea-BissauHaitiHeavily indebted poor countries (HIPC)High incomeHondurasHong Kong SAR, ChinaHungaryIBRD onlyIcelandIDA & IBRD totalIDA blendIDA onlyIDA totalIndiaIndonesiaIran, Islamic Rep.IrelandIsraelItalyJamaicaJapanJordanKazakhstanKenyaKorea, Rep.KosovoKuwaitKyrgyz RepublicLao PDRLatin America & Caribbean Latin America & Caribbean (excluding high income)Latin America & the Caribbean (IDA & IBRD countries)LatviaLebanonLiberiaLibyaLithuaniaLow & middle incomeLow incomeLower middle incomeLuxembourgMacao SAR, ChinaMacedonia, FYRMadagascarMalawiMalaysiaMaliMaltaMauritaniaMauritiusMexicoMiddle East & North AfricaMiddle East & North Africa (excluding high income)Middle East & North Africa (IDA & IBRD countries)Middle incomeMoldovaMongoliaMontenegroMoroccoMozambiqueMyanmarNamibiaNepalNetherlandsNew ZealandNicaraguaNigerNigeriaNorth AmericaNorwayOECD membersOmanOther small statesPakistanPanamaPapua New GuineaParaguayPeruPhilippinesPolandPortugalPost-demographic dividendPre-demographic dividendPuerto RicoQatarRomaniaRussian FederationRwandaSamoaSaudi ArabiaSenegalSerbiaSeychellesSierra LeoneSingaporeSlovak RepublicSloveniaSmall statesSomaliaSouth AfricaSouth AsiaSouth Asia (IDA & IBRD)South SudanSpainSri LankaSub-Saharan Africa Sub-Saharan Africa (excluding high income)Sub-Saharan Africa (IDA & IBRD countries)SudanSurinameSwazilandSwedenSwitzerlandSyrian Arab RepublicTajikistanTanzaniaThailandTimor-LesteTogoTrinidad and TobagoTunisiaTurkeyTurkmenistanUgandaUkraineUnited Arab EmiratesUnited KingdomUnited StatesUruguayUzbekistanVanuatuVenezuela, RBVietnamWest Bank and GazaWorldZambiaZimbabwe Timeline:
This timeline shows a graph from 1969 to 2016 of Mali. No data until 1968. Number of actual observations by date: 48.
Source name:
World Development Indicators
Source organization:
World Bank national accounts data, and OECD National Accounts data files.
Categories, topics:
Economy & Growth, Trade
Last updated:
apr 23, 2017
Indicators value changes by year
Minimum:
-21.341
jan 1, 1982
Maximum:
44.312
jan 1, 2002
At the date of observation
Value
Absolute change
Change from previous value
jan 1, 1969
-6.796
-6.796
0.0%
jan 1, 1970
13.545
+20.341
-299.29%
jan 1, 1971
-0.919
-14.464
-106.78%
jan 1, 1972
36.011
+36.93
-4.02K%
jan 1, 1973
-10.072
-46.084
-127.97%
jan 1, 1974
-8.8
+1.273
-12.63%
jan 1, 1975
9.649
+18.448
-209.65%
jan 1, 1976
1.602
-8.047
-83.4%
jan 1, 1977
15.748
+14.146
883.24%
jan 1, 1978
23.807
+8.059
51.18%
jan 1, 1979
-4.395
-28.202
-118.46%
jan 1, 1980
10.919
+15.314
-348.48%
jan 1, 1981
25.388
+14.468
132.5%
jan 1, 1982
-21.341
-46.728
-184.06%
jan 1, 1983
-10.55
+10.791
-50.57%
jan 1, 1984
13.696
+24.246
-229.83%
jan 1, 1985
8.673
-5.023
-36.68%
jan 1, 1986
6.849
-1.824
-21.03%
jan 1, 1987
-7.426
-14.275
-208.42%
jan 1, 1988
-0.639
+6.787
-91.4%
jan 1, 1989
7.474
+8.112
-1.27K%
jan 1, 1990
11.104
+3.63
48.57%
jan 1, 1991
0.093
-11.011
-99.17%
jan 1, 1992
13.218
+13.126
14.17K%
jan 1, 1993
8.477
-4.741
-35.87%
jan 1, 1994
4.186
-4.291
-50.62%
jan 1, 1995
6.909
+2.723
65.05%
jan 1, 1996
10.018
+3.109
44.99%
jan 1, 1997
0.445
-9.573
-95.56%
jan 1, 1998
28.486
+28.041
6.31K%
jan 1, 1999
-0.522
-29.008
-101.83%
jan 1, 2000
16.417
+16.939
-3.24K%
jan 1, 2001
5.015
-11.402
-69.45%
jan 1, 2002
44.312
+39.297
783.51%
jan 1, 2003
19.665
-24.647
-55.62%
jan 1, 2004
-9.3
-28.965
-147.29%
jan 1, 2005
-5.702
+3.598
-38.69%
jan 1, 2006
11.901
+17.603
-308.73%
jan 1, 2007
9.628
-2.274
-19.1%
jan 1, 2008
-10.412
-20.04
-208.15%
jan 1, 2009
0.719
+11.131
-106.9%
jan 1, 2010
-11.054
-11.773
-1.64K%
jan 1, 2011
-0.249
+10.805
-97.75%
jan 1, 2012
6.168
+6.417
-2.58K%
jan 1, 2013
8.754
+2.586
41.92%
jan 1, 2014
2.548
-6.205
-70.89%
jan 1, 2015
1.138
-1.411
-55.36%
jan 1, 2016
4.672
+3.534
310.69%
Ranking of countries by current statistics by years


Comments: