29
/
en
AIzaSyAYiBZKx7MnpbEhh9jyipgxe19OcubqV5w
April 1, 2024
144297
Guatemala
GTM
true
2
1
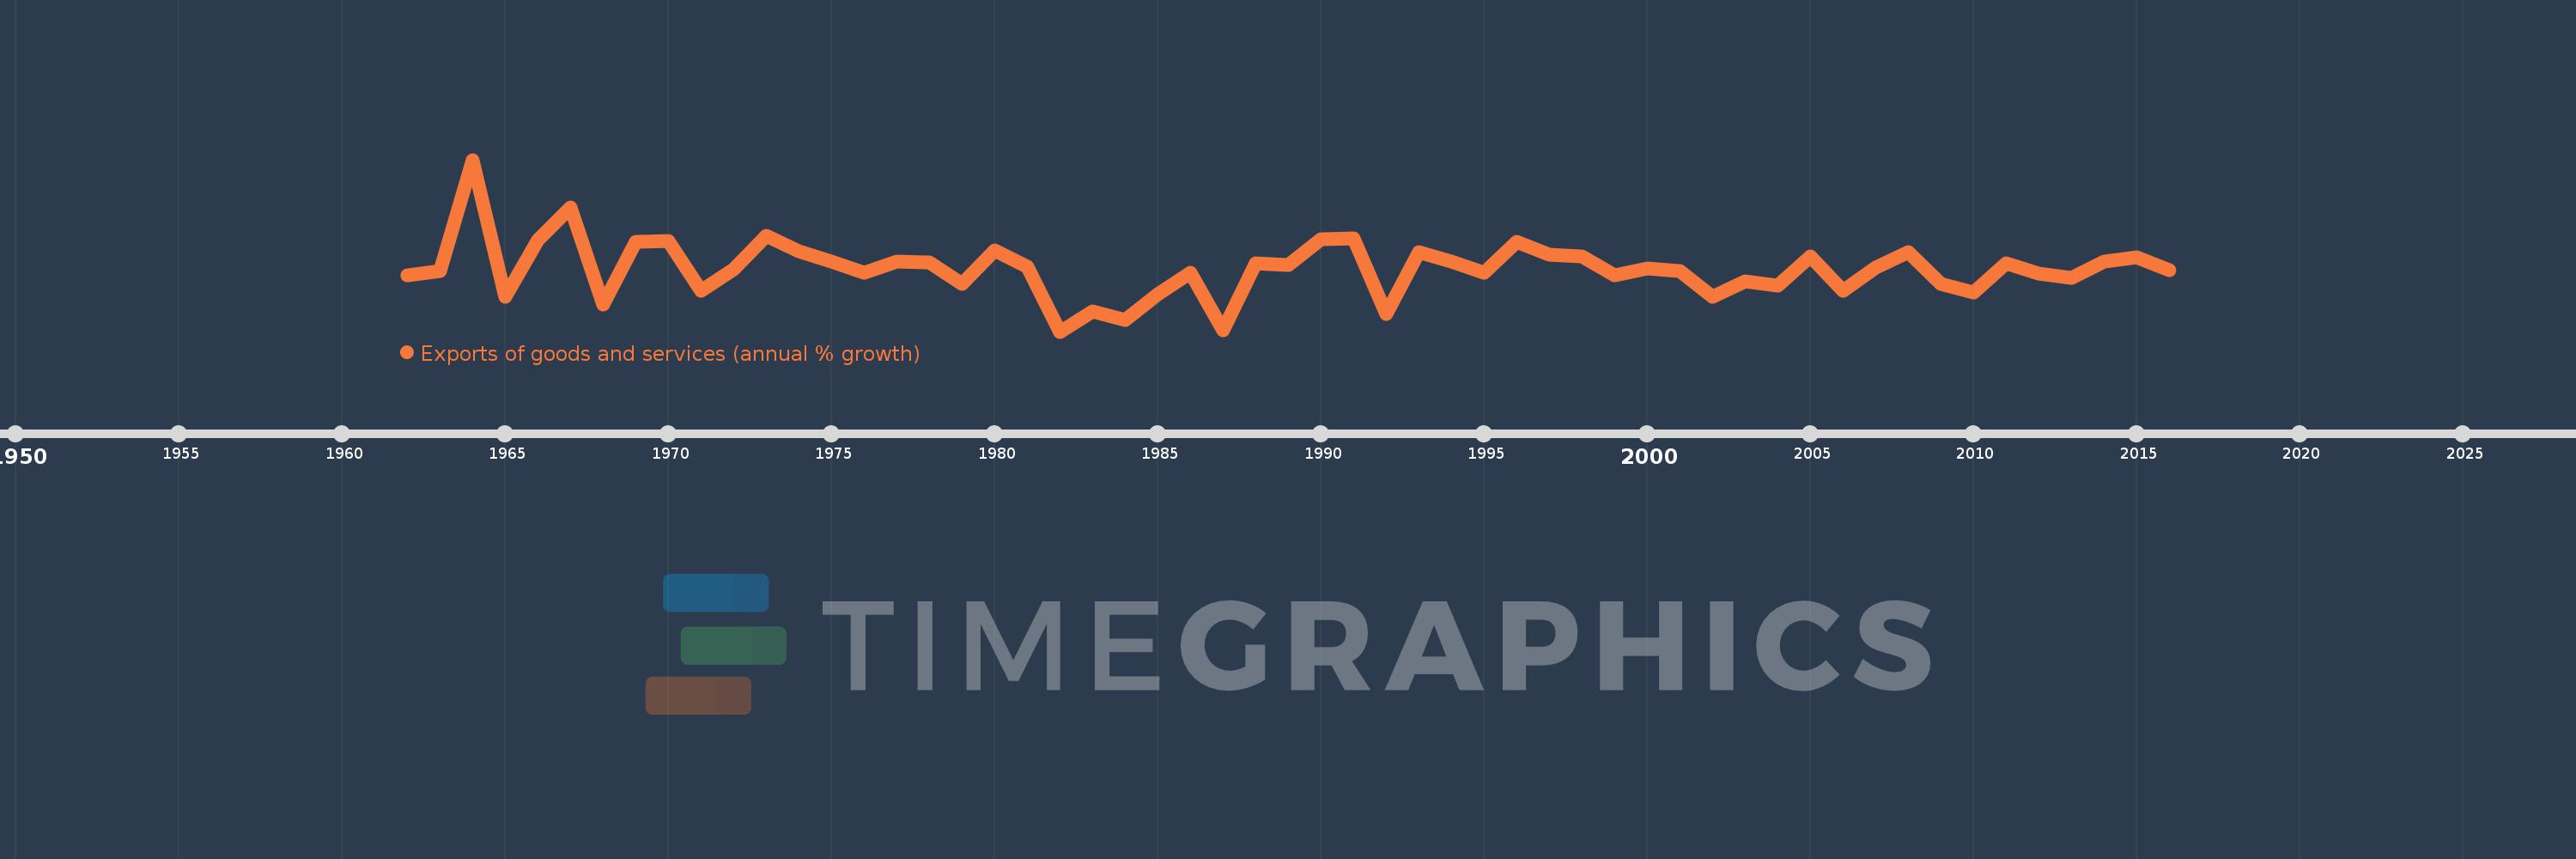
Exports of goods and services (annual % growth)
2016,2015,2014,2013,2012,2011,2010,2009,2008,2007,2006,2005,2004,2003,2002,2001,2000,1999,1998,1997,1996,1995,1994,1993,1992,1991,1990,1989,1988,1987,1986,1985,1984,1983,1982,1981,1980,1979,1978,1977,1976,1975,1974,1973,1972,1971,1970,1969,1968,1967,1966,1965,1964,1963,1962
This statistics in other country:
AlbaniaAlgeriaAngolaAntigua and BarbudaArab WorldArgentinaArmeniaAustraliaAustriaAzerbaijanBahamas, TheBahrainBangladeshBarbadosBelarusBelgiumBelizeBeninBhutanBoliviaBosnia and HerzegovinaBotswanaBrazilBrunei DarussalamBulgariaBurkina FasoBurundiCabo VerdeCambodiaCameroonCanadaCaribbean small statesCentral Europe and the BalticsChadChileColombiaComorosCongo, Dem. Rep.Congo, Rep.Costa RicaCote d'IvoireCroatiaCubaCyprusCzech RepublicDenmarkDjiboutiDominican RepublicEarly-demographic dividendEast Asia & PacificEcuadorEgypt, Arab Rep.El SalvadorEquatorial GuineaEritreaEstoniaEthiopiaEuro areaEurope & Central AsiaEurope & Central Asia (excluding high income)Europe & Central Asia (IDA & IBRD countries)European UnionFijiFinlandFranceGabonGambia, TheGeorgiaGermanyGhanaGreeceGuatemalaGuineaGuinea-BissauHaitiHeavily indebted poor countries (HIPC)High incomeHondurasHong Kong SAR, ChinaHungaryIBRD onlyIcelandIDA & IBRD totalIDA blendIDA onlyIDA totalIndiaIndonesiaIran, Islamic Rep.IrelandIsraelItalyJamaicaJapanJordanKazakhstanKenyaKorea, Rep.KosovoKuwaitKyrgyz RepublicLao PDRLatin America & Caribbean Latin America & Caribbean (excluding high income)Latin America & the Caribbean (IDA & IBRD countries)LatviaLebanonLiberiaLibyaLithuaniaLow & middle incomeLow incomeLower middle incomeLuxembourgMacao SAR, ChinaMacedonia, FYRMadagascarMalawiMalaysiaMaliMaltaMauritaniaMauritiusMexicoMiddle East & North AfricaMiddle East & North Africa (excluding high income)Middle East & North Africa (IDA & IBRD countries)Middle incomeMoldovaMongoliaMontenegroMoroccoMozambiqueMyanmarNamibiaNepalNetherlandsNew ZealandNicaraguaNigerNigeriaNorth AmericaNorwayOECD membersOmanOther small statesPakistanPanamaPapua New GuineaParaguayPeruPhilippinesPolandPortugalPost-demographic dividendPre-demographic dividendPuerto RicoQatarRomaniaRussian FederationRwandaSamoaSaudi ArabiaSenegalSerbiaSeychellesSierra LeoneSingaporeSlovak RepublicSloveniaSmall statesSomaliaSouth AfricaSouth AsiaSouth Asia (IDA & IBRD)South SudanSpainSri LankaSub-Saharan Africa Sub-Saharan Africa (excluding high income)Sub-Saharan Africa (IDA & IBRD countries)SudanSurinameSwazilandSwedenSwitzerlandSyrian Arab RepublicTajikistanTanzaniaThailandTimor-LesteTogoTrinidad and TobagoTunisiaTurkeyTurkmenistanUgandaUkraineUnited Arab EmiratesUnited KingdomUnited StatesUruguayUzbekistanVanuatuVenezuela, RBVietnamWest Bank and GazaWorldZambiaZimbabwe Timeline:
This timeline shows a graph from 1962 to 2016 of Guatemala. No data until 1961. Number of actual observations by date: 55.
Source name:
World Development Indicators
Source organization:
World Bank national accounts data, and OECD National Accounts data files.
Categories, topics:
Economy & Growth, Trade
Last updated:
apr 23, 2017
Indicators value changes by year
Minimum:
-14.406
jan 1, 1982
Maximum:
37.146
jan 1, 1964
At the date of observation
Value
Absolute change
Change from previous value
jan 1, 1962
2.353
+2.353
0.0%
jan 1, 1963
3.831
+1.478
62.84%
jan 1, 1964
37.146
+33.315
869.52%
jan 1, 1965
-3.857
-41.003
-110.38%
jan 1, 1966
13.079
+16.936
-439.15%
jan 1, 1967
22.937
+9.858
75.37%
jan 1, 1968
-6.409
-29.347
-127.94%
jan 1, 1969
12.478
+18.887
-294.68%
jan 1, 1970
12.815
+0.337
2.7%
jan 1, 1971
-2.232
-15.047
-117.42%
jan 1, 1972
4.162
+6.394
-286.44%
jan 1, 1973
14.345
+10.183
244.68%
jan 1, 1974
9.585
-4.76
-33.18%
jan 1, 1975
6.643
-2.942
-30.69%
jan 1, 1976
3.301
-3.342
-50.3%
jan 1, 1977
6.593
+3.291
99.7%
jan 1, 1978
6.223
-0.37
-5.61%
jan 1, 1979
-0.107
-6.329
-101.71%
jan 1, 1980
10.041
+10.147
-9.53K%
jan 1, 1981
5.152
-4.889
-48.69%
jan 1, 1982
-14.406
-19.558
-379.64%
jan 1, 1983
-8.451
+5.955
-41.34%
jan 1, 1984
-10.878
-2.427
28.71%
jan 1, 1985
-3.233
+7.645
-70.28%
jan 1, 1986
3.182
+6.415
-198.42%
jan 1, 1987
-13.987
-17.169
-539.58%
jan 1, 1988
6.018
+20.005
-143.03%
jan 1, 1989
5.628
-0.39
-6.48%
jan 1, 1990
13.286
+7.658
136.07%
jan 1, 1991
13.464
+0.178
1.34%
jan 1, 1992
-9.091
-22.555
-167.52%
jan 1, 1993
9.393
+18.484
-203.33%
jan 1, 1994
6.67
-2.723
-28.99%
jan 1, 1995
3.361
-3.309
-49.61%
jan 1, 1996
12.56
+9.199
273.66%
jan 1, 1997
8.686
-3.874
-30.85%
jan 1, 1998
8.103
-0.583
-6.72%
jan 1, 1999
2.394
-5.708
-70.45%
jan 1, 2000
4.604
+2.21
92.29%
jan 1, 2001
3.817
-0.787
-17.09%
jan 1, 2002
-3.99
-7.807
-204.53%
jan 1, 2003
0.71
+4.7
-117.8%
jan 1, 2004
-0.518
-1.228
-172.87%
jan 1, 2005
8.217
+8.735
-1.69K%
jan 1, 2006
-2.11
-10.327
-125.67%
jan 1, 2007
4.791
+6.9
-327.09%
jan 1, 2008
9.416
+4.625
96.55%
jan 1, 2009
-0.163
-9.579
-101.73%
jan 1, 2010
-2.661
-2.498
1.53K%
jan 1, 2011
6.134
+8.795
-330.49%
jan 1, 2012
3.008
-3.126
-50.96%
jan 1, 2013
1.754
-1.254
-41.7%
jan 1, 2014
6.663
+4.909
279.94%
jan 1, 2015
7.931
+1.269
19.04%
jan 1, 2016
4.042
-3.889
-49.04%
Ranking of countries by current statistics by years


Comments: